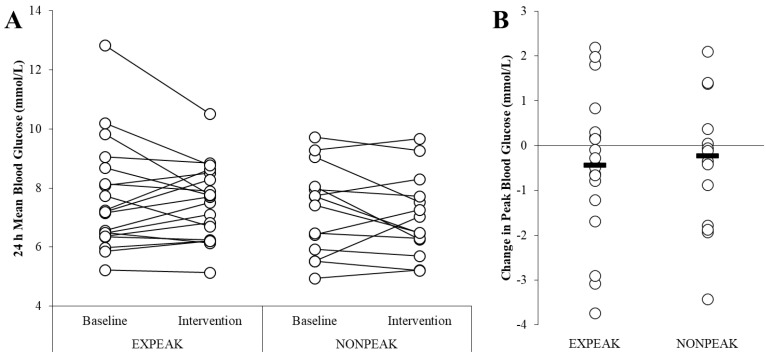
Figure 2.
Mean and peak blood glucose levels (mmol/L) at baseline and during the two-week intervention. (A) Mean blood glucose was similar at baseline and during the intervention for the ExPeak (base: 7.66 ± 1.85 mmol/L, int: 7.51 ± 1.28 mmol/L, p = 0.56) and NonPeak (base: 7.27 ± 1.51, int: 7.03 ± 1.37 mmol/L, p = 0.35) groups. (B) The change in peak blood glucose (mmol/L) was similar between the ExPeak (−0.44 ± 1.6 mmol/L, Cohen’s d: 0.21) and NonPeak (−0.39 ± 1.5 mmol/L, Cohen’s d: 0.16) intervention groups (p = 0.92). Values are mean ± SD, n = 33.

