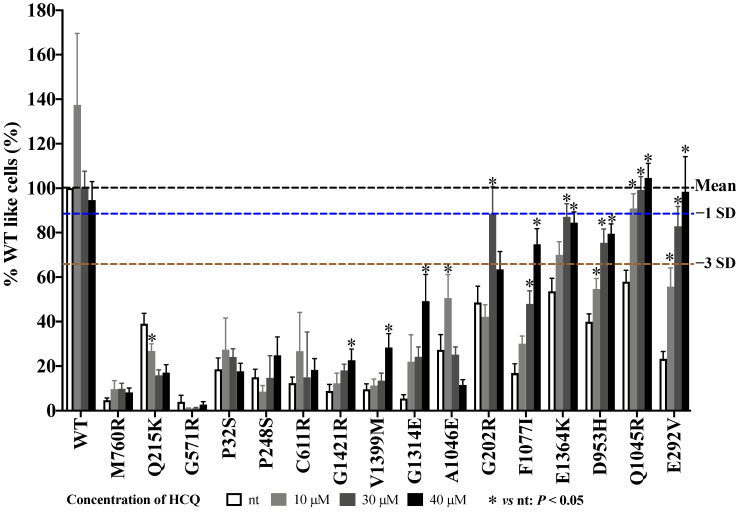
Figure 3.
Response of 16 ABCA3 variants to HCQ in vitro assessed using high-content screening method. Results (% WT nt) were shown as means + S.E.M (Individual values were listed in Figure S5). Black dotted line indicated mean value. Blue dotted line indicated mean −1 nSD. Brown dotted line indicated mean −3 nSD. * indicates p value < 0.05.

