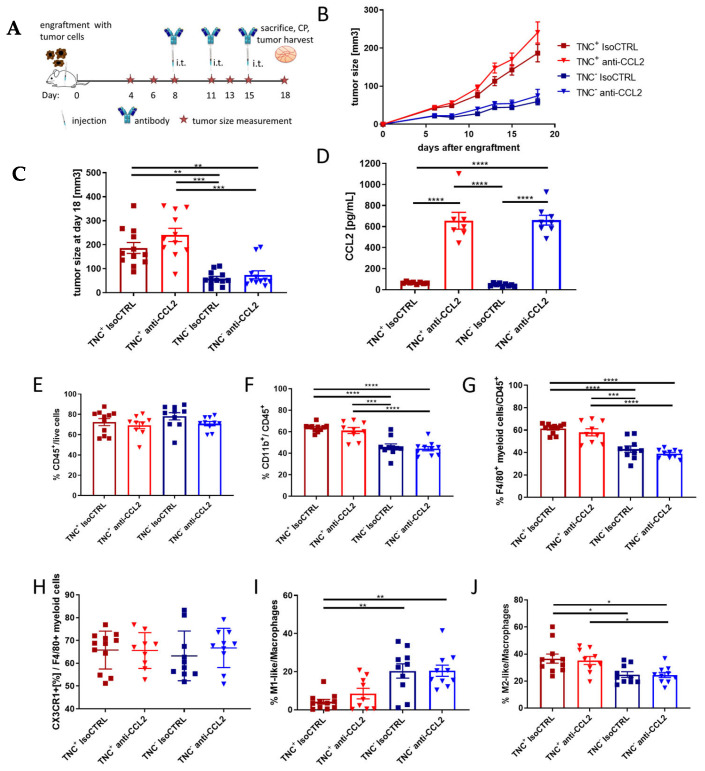
Figure 5.
In vivo breast cancer model: (A) Timeline of engraftment, tumor size measurements, antibody injections, sacrifice, cardiac puncture (CP) and tumor harvest. (B) Tumor size of FVB mice engrafted with NT193 TNC+ (red) or NT193 TNC−(sh2) (blue), treated with anti-CCL2 antibody (triangles) or isotype control (IsoCTRL) (squares) over 18 days and (C) on day 18. The data represent four independent experiments and are represented as means +/− SEM. n = 11–12/group. Non-parametric ANOVA and Dunn’s multiple comparisons tests were performed. *** p < 0.001, ** p < 0.01. (D) CCL2 protein in serum samples from cardiac puncture after sacrifice on day 18 determined via ELISA. The data represent three independent experiments and are represented as means +/−SEM. Ordinary one-way ANOVA and Tukey’s multiple comparisons test. **** p < 0.0001. (E–J) Percentage of respective population in TNC+ (red) and TNC−(sh2) (blue) tumors injected with isotype control antibody (IsoCTRL, squares) or anti-CCL2 antibody (triangles). The data represent four independent experiments. n = 9–11/group. In all graphs, means +/− SEM is shown. Ordinary one-way ANOVA and Tukey’s multiple comparisons test or non-parametric ANOVA and a Dunn’s multiple comparisons test were performed, **** p < 0.0001, *** p < 0.001, ** p < 0.01, * p < 0.05. All significant differences are shown, otherwise they are ns.

