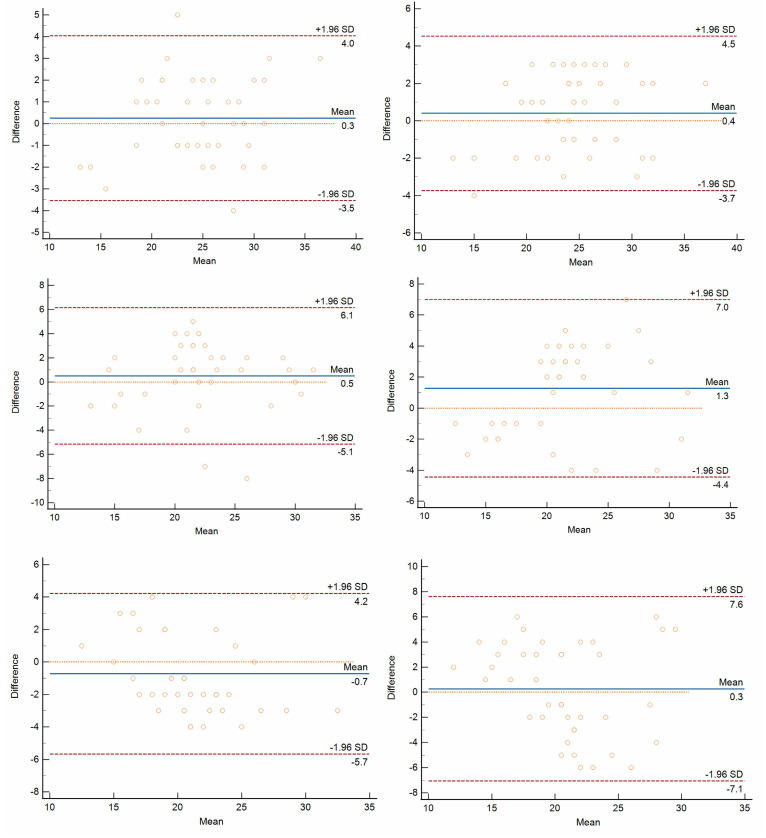
Figure 3.
Bland–Altman plots show intra-observer (left column) and inter-observer (right column) variability of FNPO assessments based on SSFSE-DL (upper row), SSFSE (middle row) and FSE (lower row) images. The x-axis represents the mean of two measurements, and the y-axis represents the differences between the two measurements. The solid lines (blue) indicate the mean differences between all measurements. The upper dashed lines (red) indicate a mean difference of + 1.96 SD, and the lower dashed lines (red) indicate a mean difference of −1.96 SD. The limits of agreement (mean difference ± 1.96 SDs) are expected that the limits include 95% of the differences between the two measurements.

