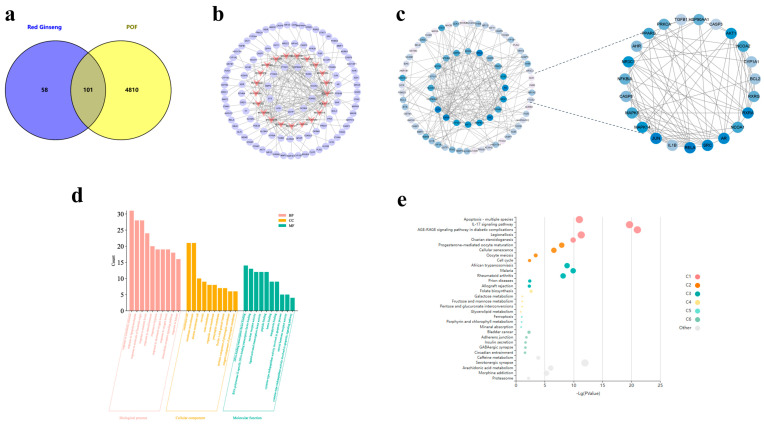
Figure 1.
Visualization of interacting targets in the active components of red ginseng and POF. Venn diagram of the numbers of overlapping and specific targets in red ginseng pairs (blue circle) and POF (yellow circle) (a); complex target pathway network of red ginseng against POF. The pink V-shaped node is the active component in red ginseng and the blue node is the potential target (b). The selected core objectives (c); GO enrichment of red ginseng against POF and KEGG pathway analysis of POF targets (d,e).

