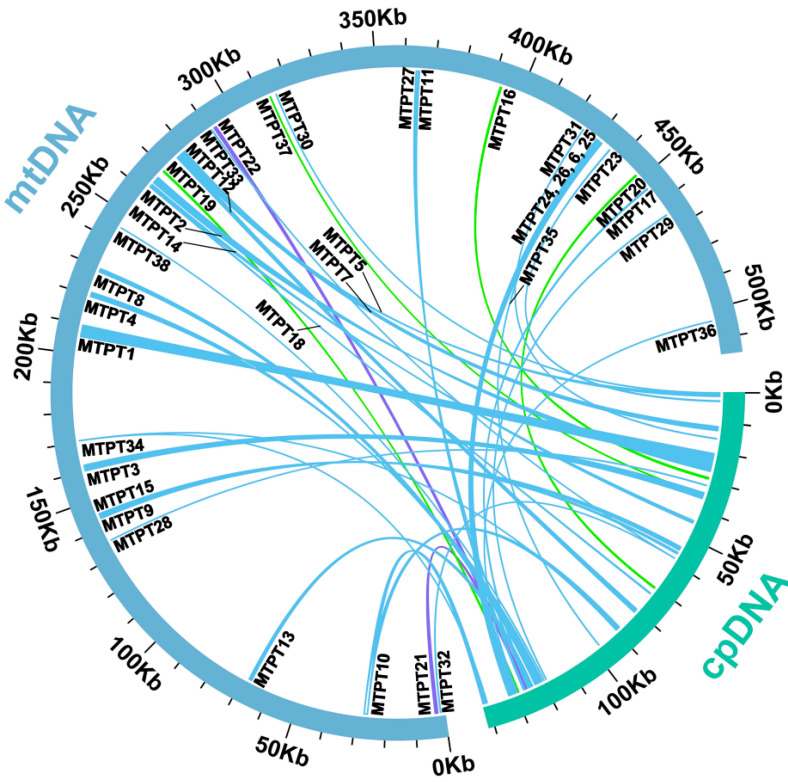
Figure 6.
Schematic representation of homologous sequences between chloroplast genome and mitogenomes in P. aculeata. The blue arcs represent mitogenomes, the green arcs represent chloroplast genomes, and the lines between arcs correspond to homologous genome segments. A total of 38 MTPTs were identified, and their numbers are given in the figure. Among them, lines with a percentage of sequence similarity above 90 are blue, those between 80 and 90 are green, and those less than 80 are purple. A total of 17 complete genes migrated to the mitogenome, including 8 PCGs and 9 tRNA genes. These complete genes were labeled next to the corresponding MTPT. Some homologous sequences are in the IR region of the plastome. We count them according to unique locations on the mitogenome.

