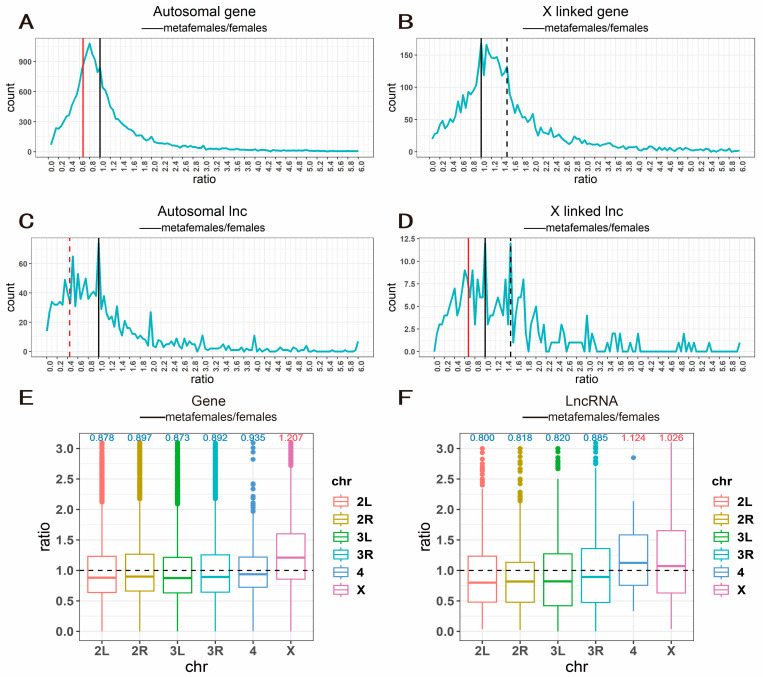
Figure 1.
Ratio distribution of gene expression of metafemale flies. When mapping, it is divided into autosomes and X chromosomes according to the location of the transcripts on the chromosome and divided into mRNAs and lncRNAs according to the type of transcripts. (A,B) Ratio distributions of gene expression in metafemale (XXX) compared with normal diploid individuals. All genes are divided into autosomal genes (A) and X linked genes (B) according to their positions on chromosomes. The vertical red solid line represents the ratio 0.67 (the ratio of inverse dosage effects (2/3)), the vertical black solid line represents the ratio 1.00 (no change) and the vertical black dashed line shows the ratio 1.50 (the ratio of gene dosage effects (3/2)). The frequencies were plotted in bins of 0.05. (C,D) Ratio distribution of lncRNAs in metafemale (XXX) compared with normal diploid individuals. All genes are divided into autosomal lncRNAs (C) and X linked lncRNAs (D) according to their positions on chromosomes. The vertical red solid line represents 0.67 (the ratio of inverse dosage effects (2/3)), the vertical black solid line represents 1.00 (no change), the vertical red dashed line represents 0.44 (the ratio of double inverse dosage effect (0.67 × 0.67)) and the vertical black dashed line represents 1.5 (the ratio of gene dosage effects (3/2)). The horizontal axis represents the ratio of gene expression values compared to normal females, and the vertical axis represents the frequency ratios that fall into each bin of 0.05. (E,F) Boxplots of gene expression ratios of mRNAs (E) and lncRNAs (F) on individual chromosomes; the top numbers represent the medians of gene expression ratios, where red indicates upregulation and blue indicates downregulation.

