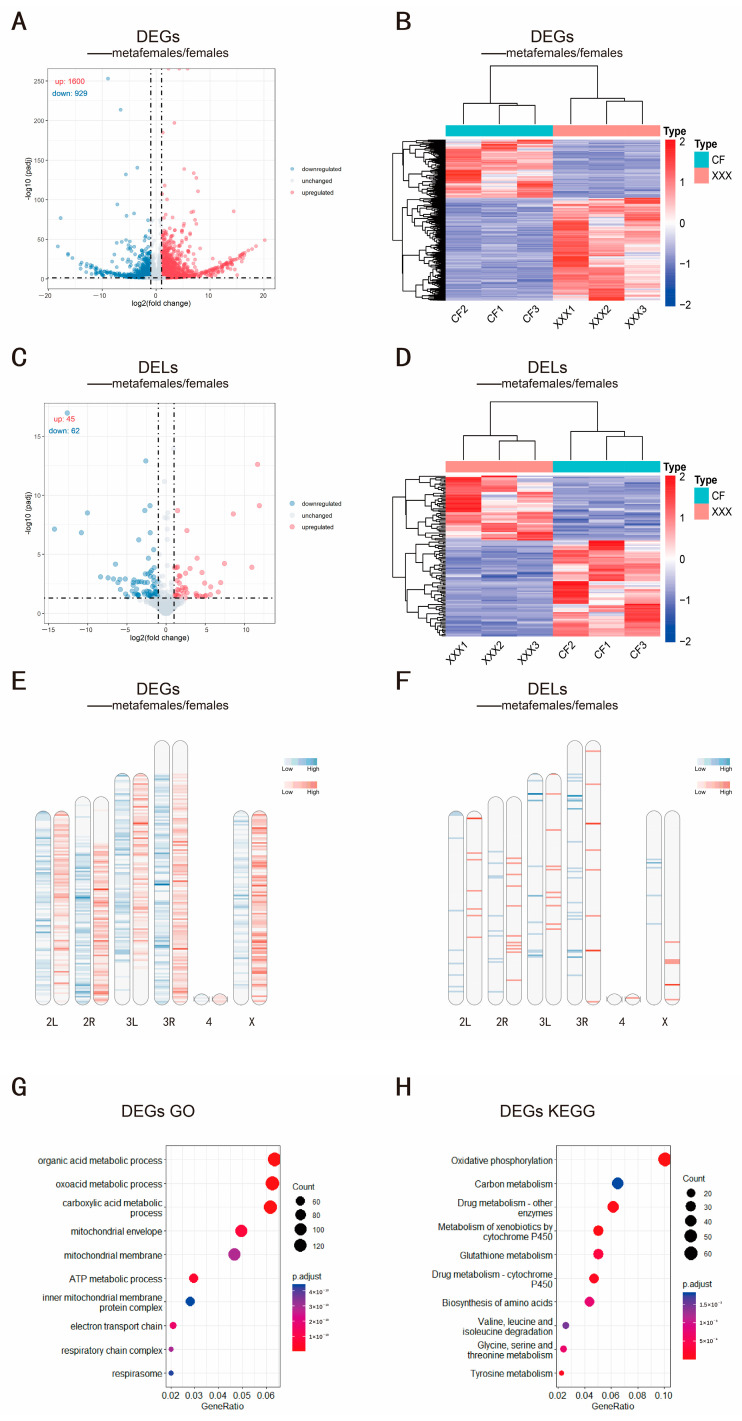
Figure 2.
DEG and DEL analysis of metafemale and diploid females and enrichment of DEGs. (A,B) Volcano map and heatmap of DEGs, where CF represents normal diploid female Drosophila and XXX represents metafemale Drosophila. (C,D) Volcano map and heatmap of DELs. (E,F) Density heatmaps of the distribution of DEGs and DELs along chromosomes in metafemale Drosophila. The red bands represent upregulated DEGs or DELs, and the blue bands represent downregulated DEGs or DELs, respectively. The darker colors show a greater density of the DEGs or DELs. (G) Bubble chart of GO enrichment analysis of differential genes. (H) Bubble chart of KEGG enrichment analysis of differential genes. The picture shows the top 10 terms of the enrichment results, where the X-axis represents the gene ratio, that is, the ratio of the number of genes in a certain term to the number of genes in all alignments, and the y-axis represents the specific enriched term. The color of the bubble reflects the p-adjust value of the enrichment, and the size of the bubble reflects the number of genes enriched in the term.

