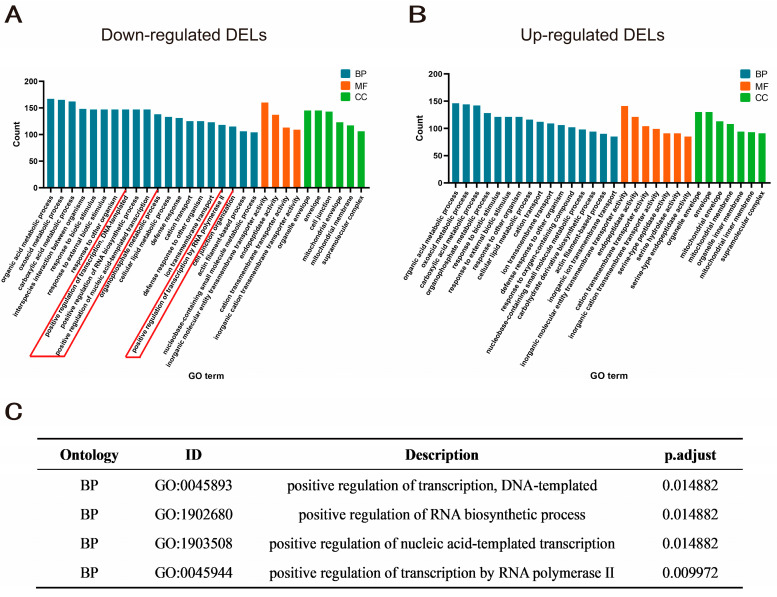
Figure 3.
Enrichment of target genes for DELs. (A,B) GO enrichment results of target genes of down and upregulated DELs. The horizontal axis represents the enriched GO terms, the vertical axis represents the number of genes enriched for each GO term, and the three colors from left to right represent biological processes, molecular function and cellular composition, respectively. (C) The enrichment information for GO terms related to the positive regulation of transcription process.

