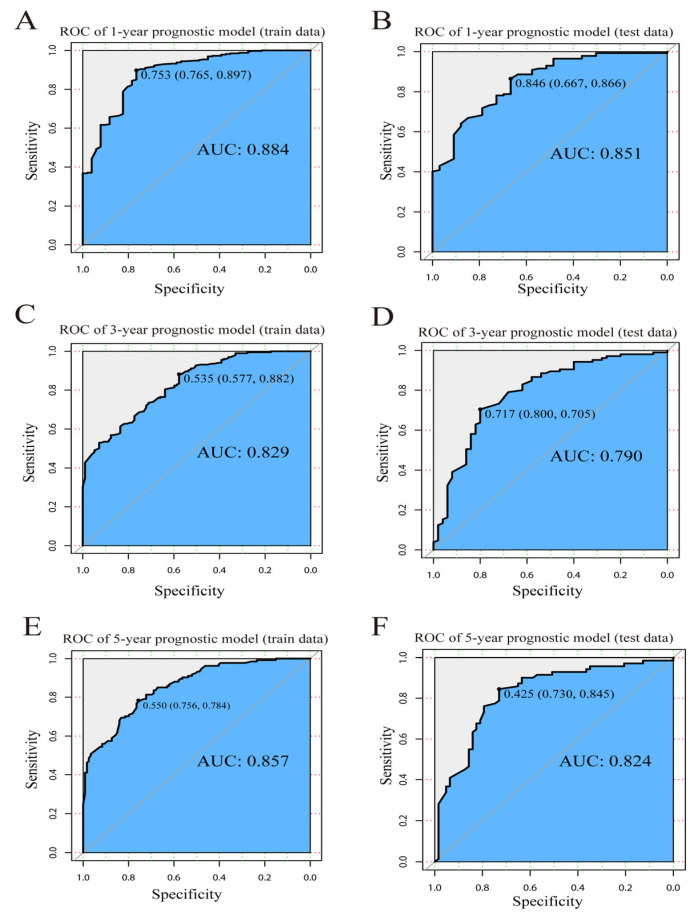
Figure 2.
ROC curve of LR model. ROC curve for (A) the 1-year prognostic model using train data; (B) the 1-year prognostic model using test data; (C) the 3-year prognostic model using train data; (D) the 3-year prognostic model using test data; (E) the 5-year prognostic model using train data; and (F) the 5-year prognostic model using test data.

