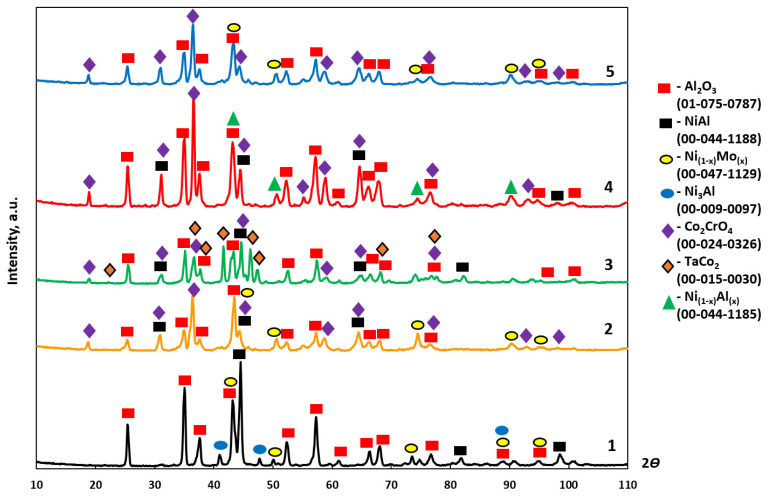
Figure 11.
XRD spectra of the oxidized surface of the base+X samples with compositions 1–5 after high-temperature oxidation resistance testing at 1150 °C during 30 h: (1) X = 2.5%Mo-0.5%Re-0.5%Ta; (2) X = 2.5%Mo-1.5%Re-1.5%Ta; (3) X = 2.5%Mo-1.5%Ta-1.5%La-0.5%Ru; (4) X = 2.5%Mo-1.5%Re-1.5%Ta-0.2%Ti; and (5) X = 2.5%Mo-1.5%Re-1.5%Ta-0.2%Zr.

