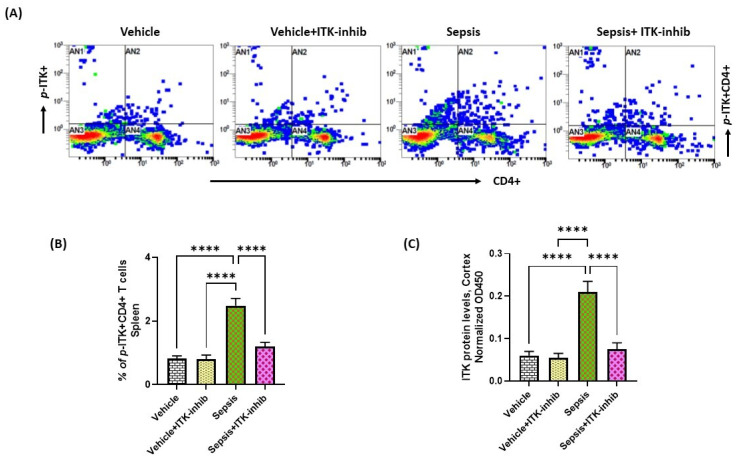
Figure 1.
Elevation of ITK signaling in the periphery and CNS of sepsis survivor mice. (A) Representative flow plot for p-ITK+ CD4+ T cells’ immunostaining; (B) % of p-ITK+ CD4+ T cells; and (C) ITK protein levels in the cerebral cortex. Values are depicted as the mean ± SEM, n = 6–8/group. **** p < 0.0001.

