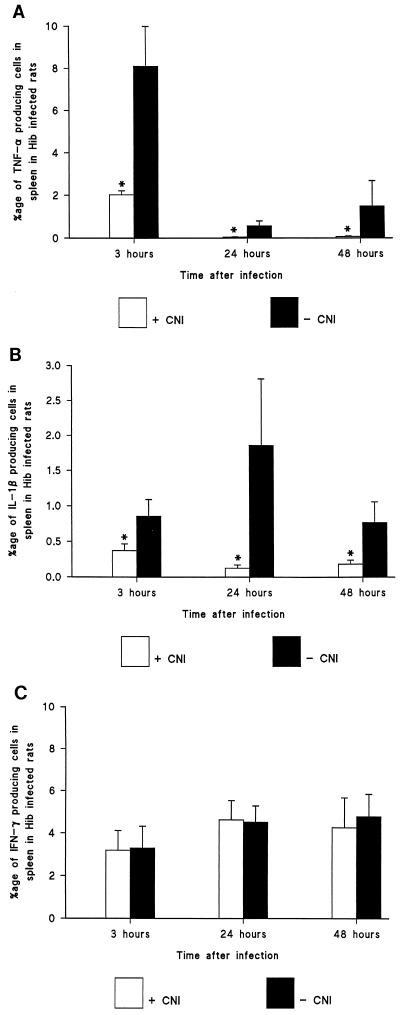
FIG. 2.
Immunohistochemical staining and calculation by computerized imaging of cytokine-producing cells in spleen. Cells producing TNF-α (A), IL-1β (B), and IFN-γ (C) in the spleen were analyzed. The bars illustrate mean percentages ± standard errors of positively stained cells per total cell area at 3, 24, and 48 h after i.p. Hib injection, with and without CNI-1493 treatment (5 mg/kg, given i.p.) (n = 5 per group). P was <0.05 between the groups at each time point for TNF-α and IL-1β. No significant difference was found at any point of time for IFN-γ.

