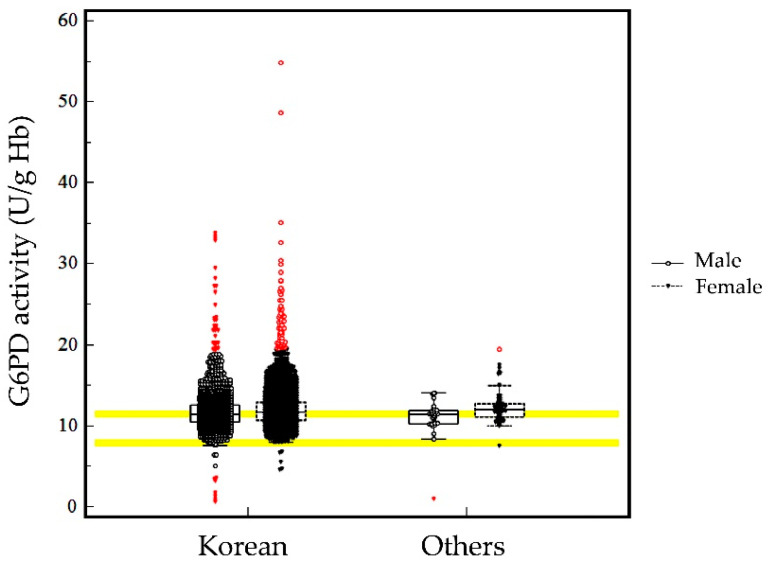
Figure 1.
G6PD enzyme activity. Black open circles represent data from male subjects, and black closed inverted triangles represent data from female subjects. Boxes represent interquartile ranges; horizontal lines in the box at the medians; inner fences represent 3 × interquartile levels; and red dots (inverted red triangles for males and a red open circle for females) represent value outside the fences in the box-and-whisker plot. The upper bold yellow line is the adjusted male median (11.4 U/g Hb), and the lower bold yellow line is the lower limit of reference intervals (7.9 U/g Hb).

