
Figure 1.
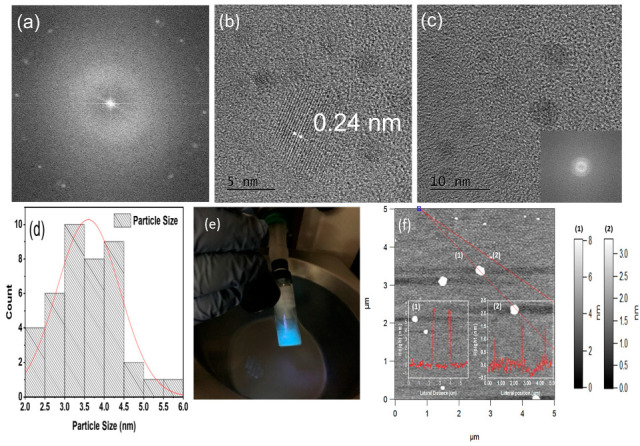
(a) SAED pattern, (b) TEM image of NGQDs at 5 nm, (c) TEM image of NGQDs at 10 nm, (d) histogram of NGQDs particle size distribution from TEM scan, (e) synthesized NGQDs under UV light exposure, and (f) AFM image of NGQDs with different line profiles (insets numbered (1) and (2)), showing the corresponding height of the selected particles.