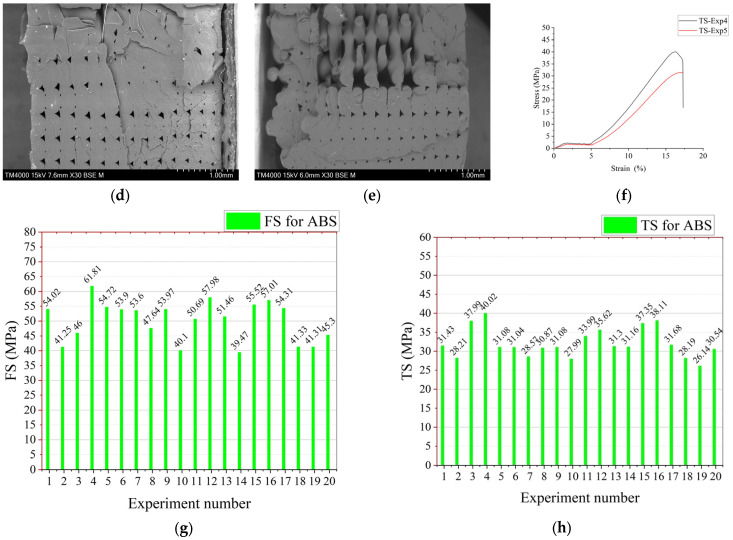
Figure 6.
SEM images of TS and FS samples: (a) FS-Exp 4 (ID = 100%, PS = 75 mm/s, LT = 0.22 mm), (b) FS-Exp number 14 (ID = 20%, LT = 0.3 mm, PS = 75 mm/s), (c) Stress strain curve for Exp 4 and 14, (d) TS-Exp 4 (ID = 100%, PS = 61 mm/s, LT = 0.22 mm), (e) TS-Exp 5 (ID = 52% PS = 61 mm/s, LT = 0.22), (f) Stress strain curve for Exp 4 and 5, and (g) FS results for ABS (h) TS results for ABS.


