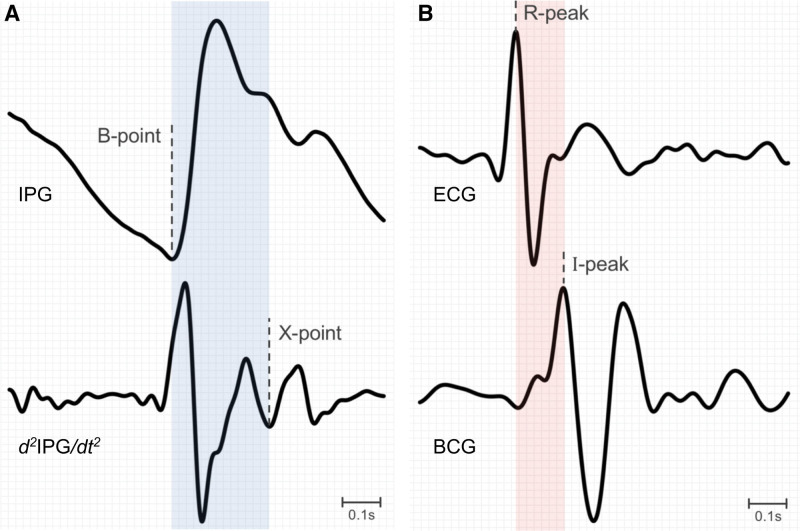
Figure 6.
Assessment of left ventricular ejection time using the cardiac scale. A, The LVET interval (blue) is calculated as the time interval between the B-point from the IPG signal and the X-point from the IPG derivative (ΔIPG). B, The PEP interval (pink) is the time interval between the R-peak from the ECG and the I-peak from the BCG signal. BCG indicates ballistocardiography; and IPG, impedance plethysmography.

