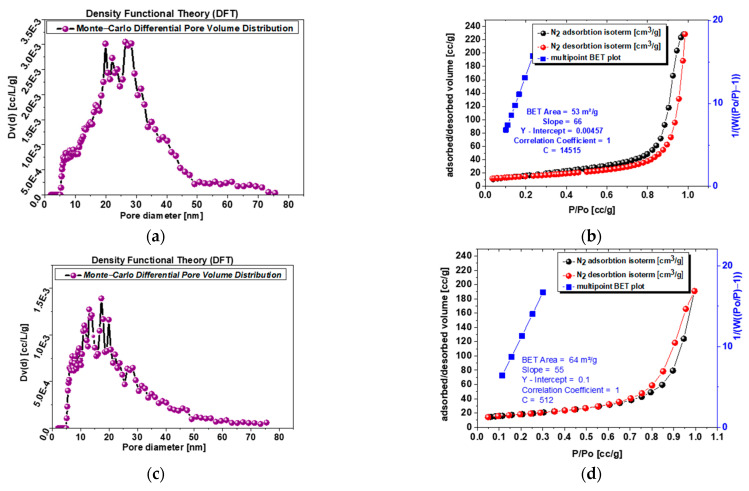
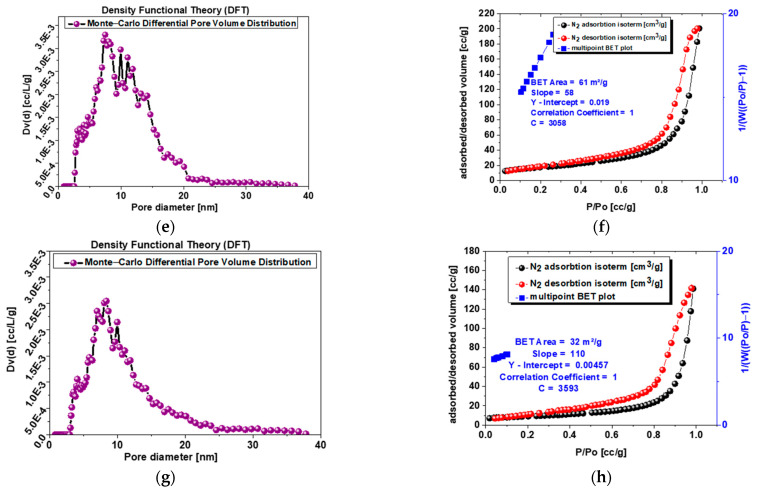
Figure 5.
(a) Sample s-1.67 mesopore size differential distribution according to DFT (Dv(d) [cc/L/g]; (b) sample s-1.67 adsorption–desorption isotherms and multipoint BET plot; (c) sample c-1.67 mesopore size differential distribution according to DFT (Dv(d) [cc/L/g]; (d) sample c-1.67 adsorption–desorption isotherms and multipoint BET plot; (e) sample 1.5 mesopore size differential distribution according to DFT (Dv(d) [cc/L/g]l; (f) sample 1.5 adsorption–desorption isotherms and multipoint BET plot.; (g) sample 1.0 mesopore size differential distribution according to DFT (Dv(d) [cc/L/g]; (h) sample 1.0 adsorption–desorption isotherms and multipoint BET plot.


