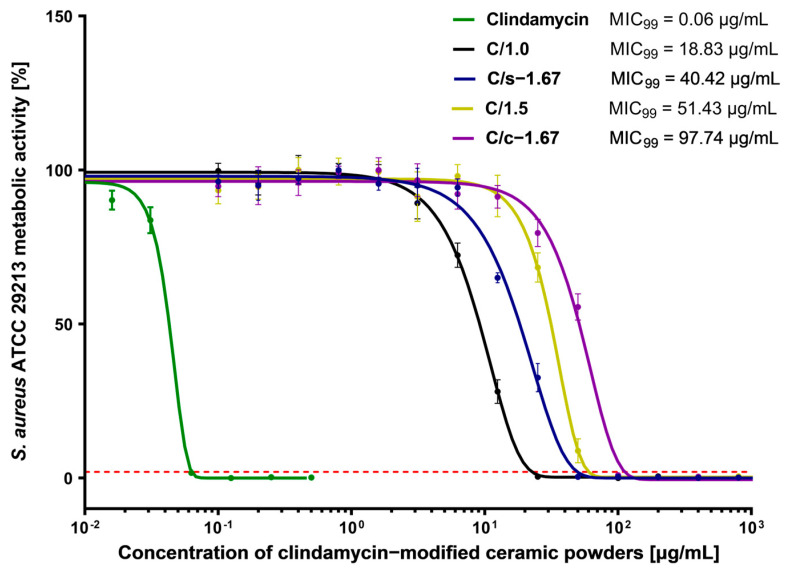
Figure 10.
Dose-response curves of clindamycin-modified ceramic powders against Staphylococcus aureus ATCC 29213 and MIC99 values. The green line represents the reference curve of bacterial metabolic inhibition for clindamycin. The intersection of the dose-effect curves with the red line (the 99% reduction in bacterial metabolic activity) is identified as the MIC99 value. Each point represents the averages of four independent experiments in triplicate. Error bars indicate standard deviations.

