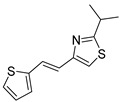
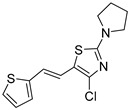
Table 2.
Calculated IC50 values and inhibitions percents for thiazoles 1a–10a and 1–5, and oxazoles 11–23.
| Comp. Number |
Structure | IC50 (μM) BChE |
Inhibition (%) (a) |
Comp. Number |
Structure | IC50 (μM) BChE |
Inhibition (%) (a) |
|---|---|---|---|---|---|---|---|
| 1 |

|
107.3 | 79.1 (500) | 11 |

|
- | 0.9 (188.0) |
| 2 |

|
- | 46.8 (200) | 12 |

|
- | 40.9 (176.0) |
| 3 |

|
51.1 | 75.4 (250) | 13 |

|
350.7 | 57.8 (396.8) |
| 4 |

|
41.9 | 70.8 (200) | 14 |

|
154.7 | 63.3 (173.6) |
| 5 |

|
- | 24.9 (250) | 15 |

|
44.4 | 98.3 (368.6) |
| cis-1a |

|
- | 36.4 (500) | 16 |

|
137.4 | 64.9 (201.7) |
| trans-1a |

|
181.4 | 64.0 (500) | 17 |

|
- | 16.8 (159.5) |
| cis-2a |

|
- | 45.5 (250) | 18 |

|
- | 38.0 (273.6) |
| trans-2a |

|
- | 45.8 (250) | 19 |

|
170.2 | 81.9 (405.2) |
| trans-3a |

|
- | 10.0 (250) | 20 |

|
183.9 | 82.2 (364.2) |
| 5a |

|
- | 30.6 (250) | 21 |

|
- | 32.6 (312.3) |
| trans-8a |

|
25.2 | 80.5 (250) | 22 |

|
127.7 | 69.9 (315.8) |
| trans-9a |

|
- (b) | 47.7 (100) | 23 |

|
- | 20.6 (297.5) |
| trans-10a |

|
- (b) | 25.3 (100) | Huperzine A | 53.4 |
(a) Concentrations in μM are given in brackets for the maximal effect measured. (b) For compounds trans-9a and trans-10a, it was impossible to determine the IC50 values due to the coloration of the samples.
