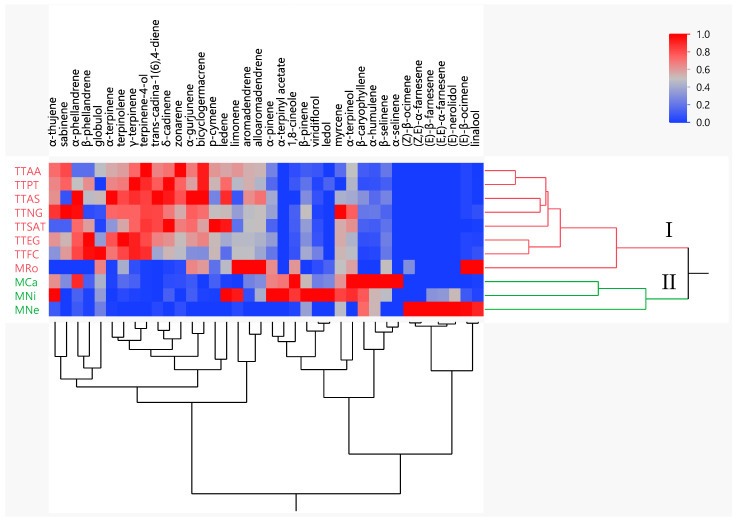
Figure 2.
Two-way dendrogram of the hierarchical cluster analysis (HCA) performed on the chemical composition of the seven tea tree (M. alternifolia) EOs and four other Melaleuca EOs. Sample codes refer to Table 1. The color box indicated the abundance of each compound. Red represents high density and blue represents low density.

