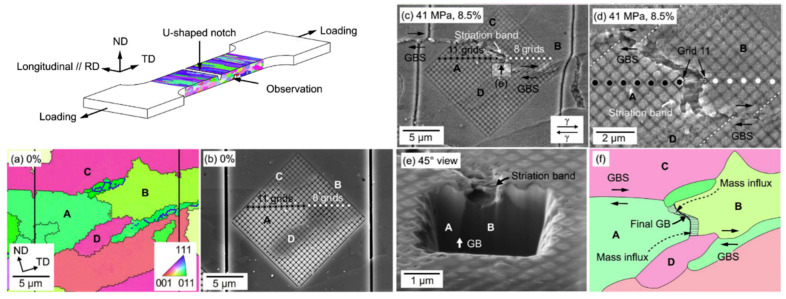
Figure 5.
Schematic diagram of the sample and IPF and SEM photos before and after creep at 900 °C and 41 MPa. (a) IPF map and (b) SEM micrograph before deformation; (c,d) SEM micrograph at different magnifications after deformation; (e) SEM micrograph on an FIB trench between grains A and B, (f) schematic diagram of the mass flux.

