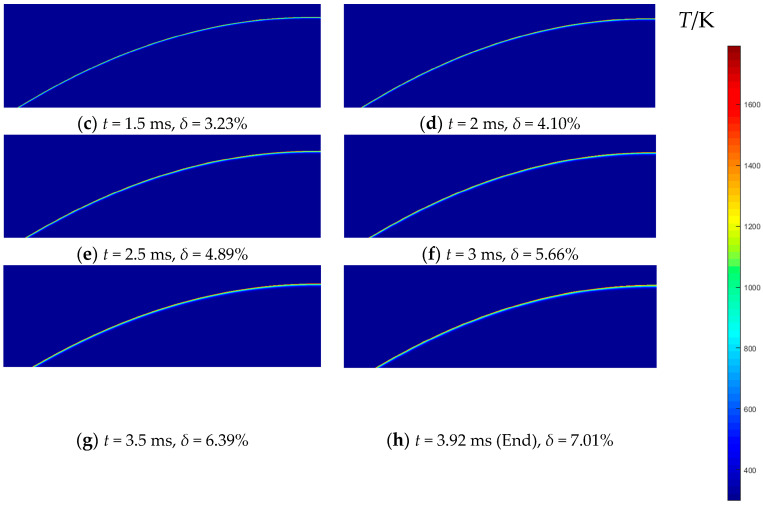
Figure 11.
Temperature field of the nose surface (Case 1, v0 = 1069 m/s). (a–h) each picture shows the outer contour of the projectile nose after erosion at current time, and displays the temperature gradient of the nose cross-section. Where δ represents the percentage of mass loss at the current time. Due to the axisymmetric structure of the projectile, only half of the projectile nose is displayed.


