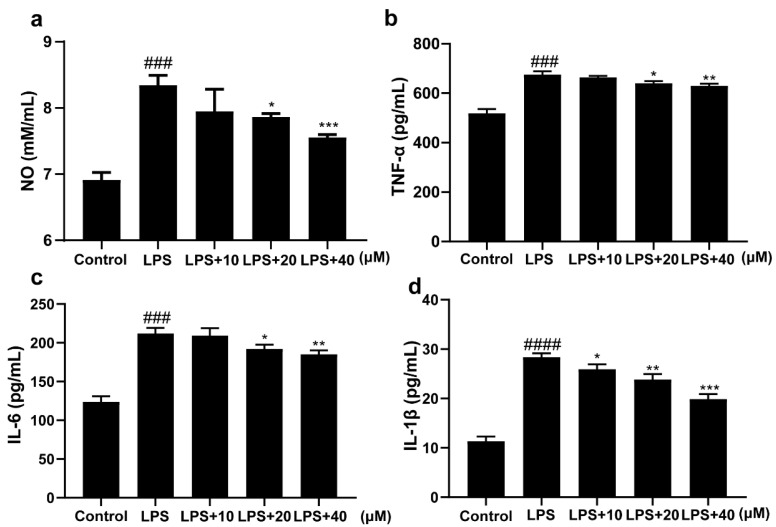
Figure 2.
Effects of 3-Iald on LPS-induced expression levels of NO, TNF-α, IL-6, and IL-1β in RAW264.7 cells. The levels of (a) NO, (b) TNF-α, (c) IL-6, and (d) IL-1β in the cell supernatants were measured using the indicated kits according to their instructions. Data were expressed as means ± SD (n = 6); ### p < 0.001, #### p < 0.0001, compared with control group; * p < 0.05, ** p < 0.01, *** p < 0.001 compared with LPS group.

