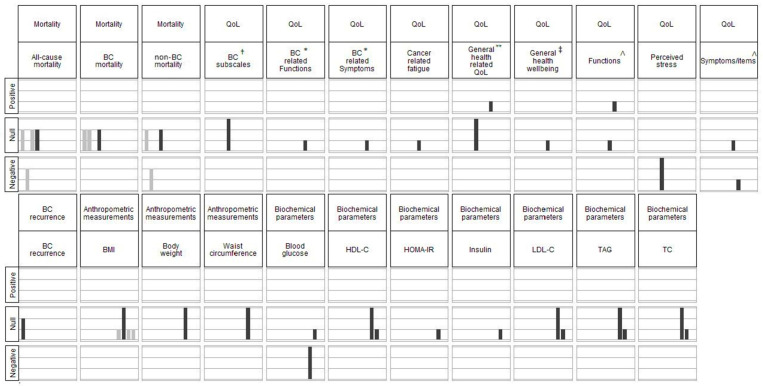
Figure 2.
Summary of the evidence (harvest plot) from all the included studies (n = 11) for the associations between MD and reported outcomes. BC: breast cancer; BMI: body-mass index; HDL-C: high-density-lipoprotein cholesterol; HOMA-IR: Homeostatic Model Assessment of Insulin Resistance; QoL: quality of life; TAG: triacylglycerol; TC: total cholesterol; LDL-C: low-density-lipoprotein cholesterol. In each bar graph in the matrix, the heights of the bars indicate designs of included studies (high: RCT, medium: cohort study, low: cross-sectional study) and the colours of the bars indicate whether the results of the study were included in the meta-analysis (grey: included in meta-analyses, black: not included in meta-analyses). The rows of the matrix indicate the detected associations (positive, none or negative) between MD adherence and the outcomes reported by each study. The columns of the matrix indicate the outcomes reported by the included studies. † Breast-cancer subscales of FACT-B scale. * Subscales of EORTC QLQ-BR23 scale. ** The overall score for FACT-G or EQ-5D-3L. ‡ The Global Health Status/QoL subscale of EORTC QLQ-C30 scale. ∧ Subscales of EORTC QLQ-C30 scale.

