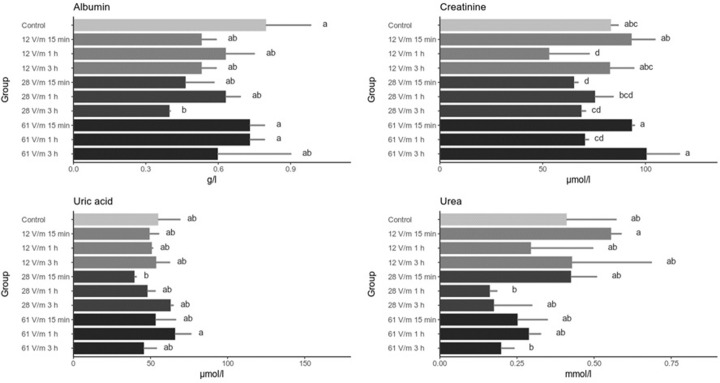
Fig 4. Level of biochemical markers in the hemolyph of bees exposed to 900 MHz EMF.
Bars represent mean values (n = 20) and the error bars the standard deviation The same letters within one graph indicate no statistically significant differences between the groups (Kruskal-Wallis test with Holm correction. α = 0.05).

