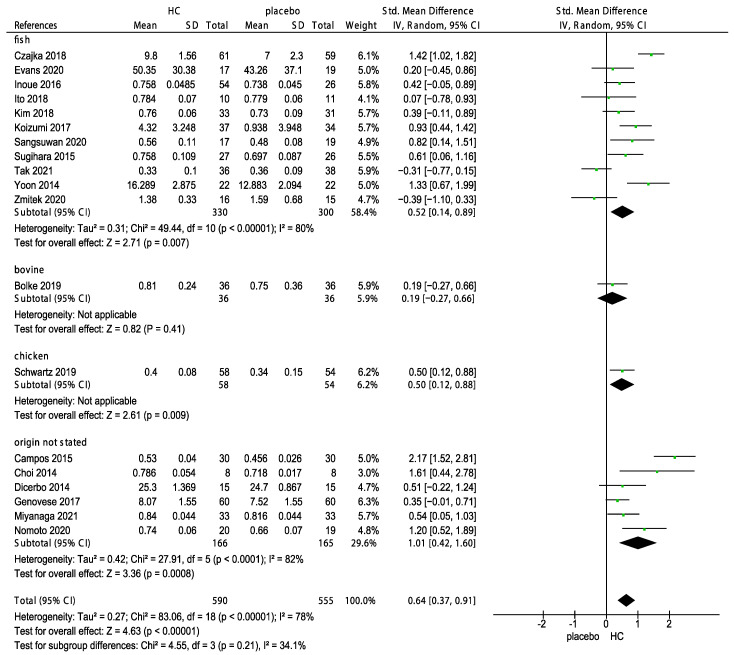
Figure 7.
Forest plot for the subgroup analysis of skin elasticity expressed as HC originating from fish, bovine, chicken, porcine, and unknown source in patients supplemented with HC and patients in the placebo group [26,27,28,29,31,32,33,34,35,37,39,40,41,42,43,44,47,48,49]. (HC: hydrolyzed collagen, CI: confidence intervals, SD: standard deviation, I2: heterogeneity).

