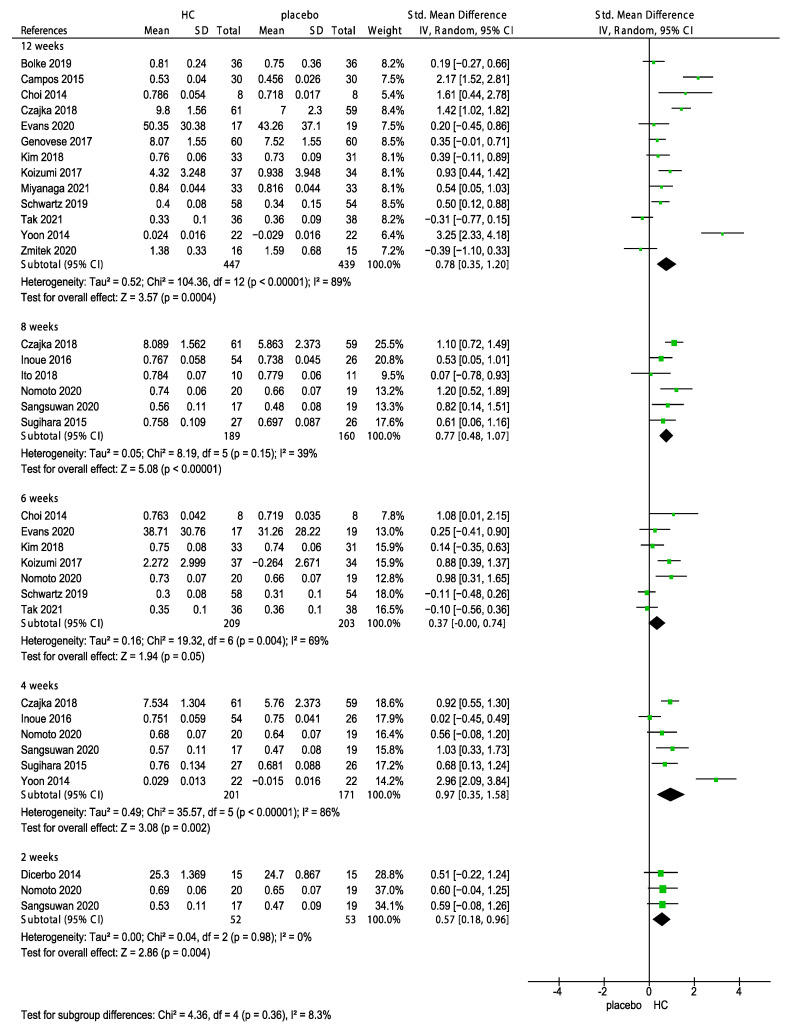
Figure 9.
Forest plot for the subgroup analysis of skin elasticity expressed as 2, 4, 6, 8, and 12 weeks in patients supplemented with HC and patients in the placebo group [26,27,28,29,31,32,33,34,35,37,39,40,41,42,43,44,47,48,49]. (HC: hydrolyzed collagen, CI: confidence intervals, SD: standard deviation, I2: heterogeneity).

