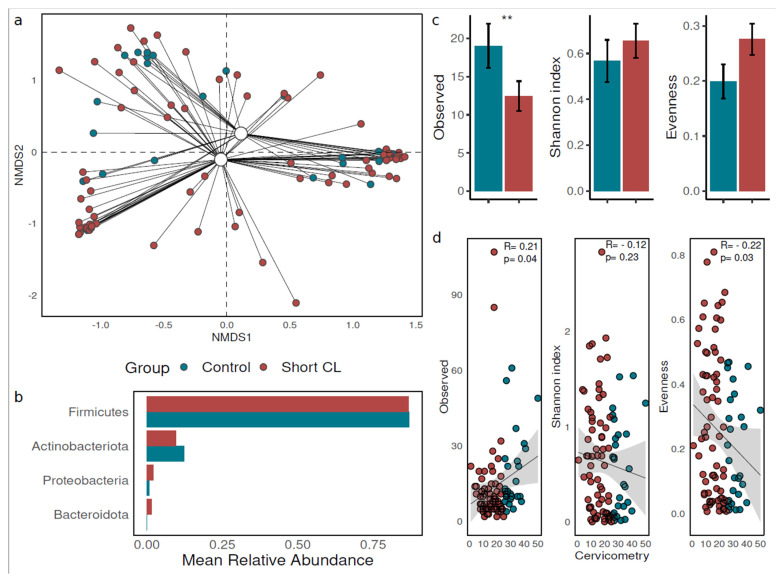
Figure 1.
Bacterial diversity among groups with different cervix length. (a) Non-metric multidimensional scaling (NMDS) analysis based on Bray–Curtis distance showing the distribution of samples with a short cervix length and controls (Group). Samples are represented using solid-coloured points while white-filled points represent centroids. (b) Barplot showing the Phylum-level mean relative abundance. The mean relative abundance measure reports the taxa present in more than 10% of samples within the dataset. (c) Barplot reporting the alpha diversity measures represented by total number of ASVs (Observed), Shannon index and Evenness (y-axis) among groups with and without short cervix (control group). Asterisks are shown above the barplot to indicate a significant effect after Kruskal–Wallis test comparison (**, p-value < 0.01). (d) Scatterplot showing the correlation between alpha diversity measures (Observed, Shannon index and Evenness) on y-axis and cervical length (Cervicometry) expressed in mm on x-axis. The shaded grey region around the linear regression line represents 95% confidence intervals. Results from linear regression analysis calculated using Spearman’s correlation method are reported inside the regression panels. Samples and sample groups in each panel were depicted according to the colour pattern in the legend.

