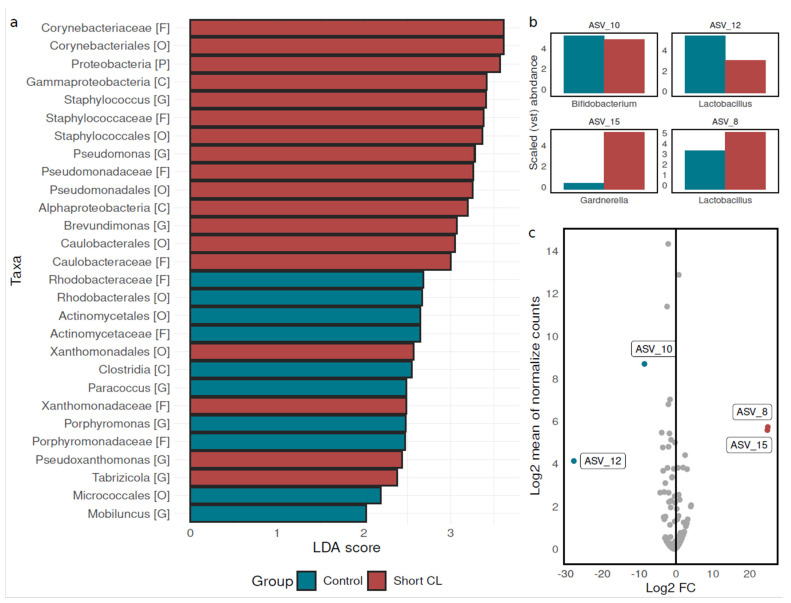
Figure 2.
Significant bacterial features among groups with different cervix length. (a) Linear discriminant analysis effect size (LEfSe) showing the significant taxonomic features between short cervix length and control groups at different taxonomic levels. Linear Discriminant Analysis scores (LDA score) are reported on x-axis (LDA threshold > 2) while taxa at different taxonomy levels are reported on y-axis. (b) Variance stabilizing transformation (VST) abundance after DESeq postcount transformation depicted for the four significant ASV obtained after Wald test. On the bottom chart the ASV taxonomic assignment was also reported and the abundance was reported for the group with a short cervix length and the control group according to the colour pattern in the legend. (c) MA plot reports the base 2 logarithm of normalised counts across all samples vs. the base 2 logarithm of fold-change (Log2FC). ASVs with fdr <0.05 are depicted using the cervix length group’s colour pattern while the others are reported in light grey.

