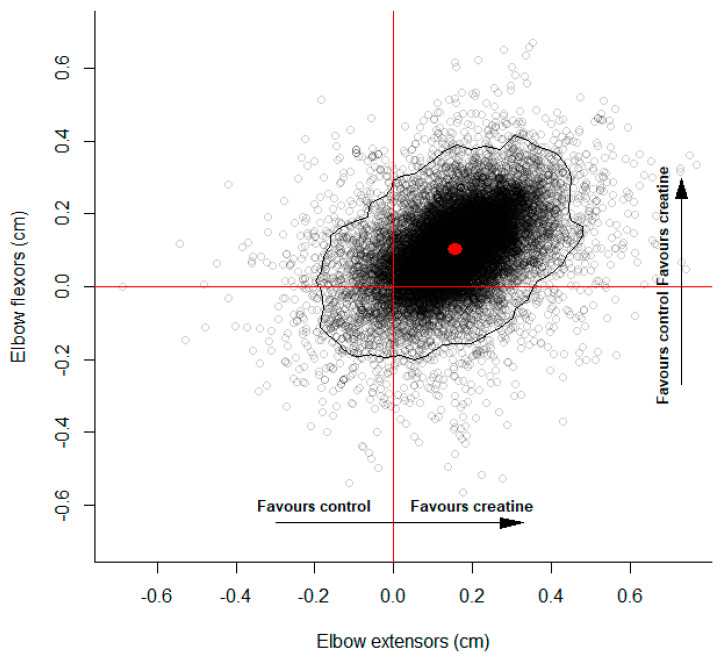
Figure 4.
Multivariate controlled mean difference posterior estimates for elbow flexors and extensors. Points represent multivariate mean difference posterior estimates. Positive values favor creatine supplementation and negative values favor control. Red dot illustrates median values for the marginal mean difference posterior estimates. Black curve represents the 95% highest posterior density region.

