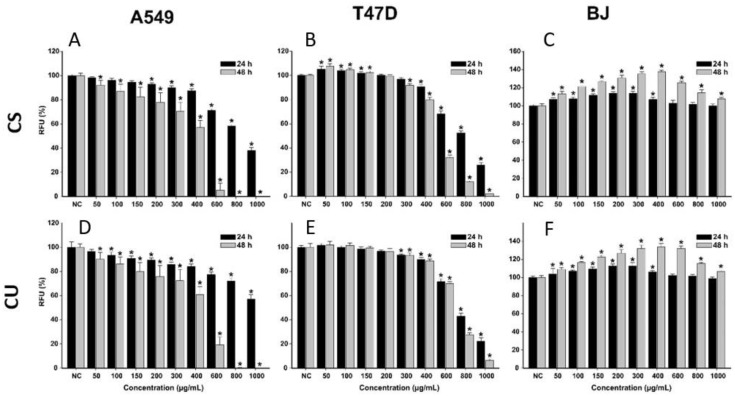
Figure 5.
Cytotoxic effect of the CS (A–C) and CU (D–F) on A549 (A,D), T47D-KBluc (B,E), and BJ (C,F) cells. Data are presented as relative means ± standard deviations (6 technical replicates for each of the three biological replicates), where the negative control (NC) is 100%. Asterisks (*) mark a significant difference (p < 0.05) in comparison with the NCRFU–relative fluorescence units.

