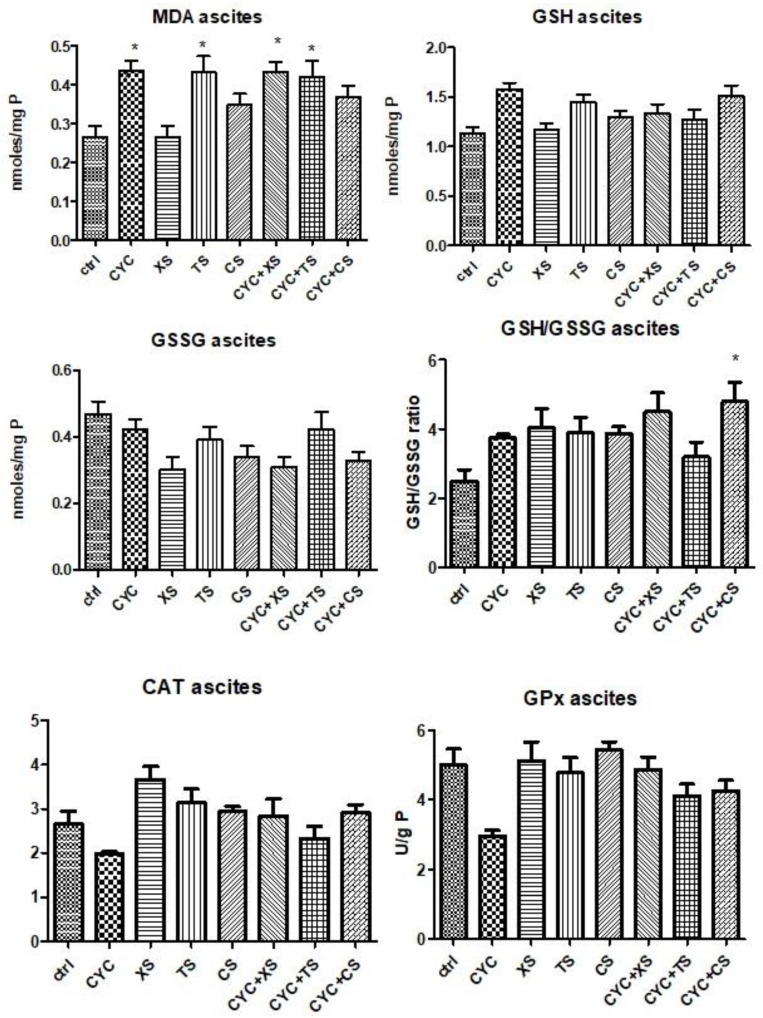
Figure 8.
Oxidative stress markers (MDA levels, GSG/GSSG ratio, CAT, and GPx activities) from the mice ascites samples after a 10-day treatment with CYC, XS, TS, CS, and associations of CYC and each of the separate extracts (Values are means ± SD. Statistical analysis was performed using a one-way ANOVA, with Tukey’s multiple comparisons post-test (* p < 0.05 vs. control group).

