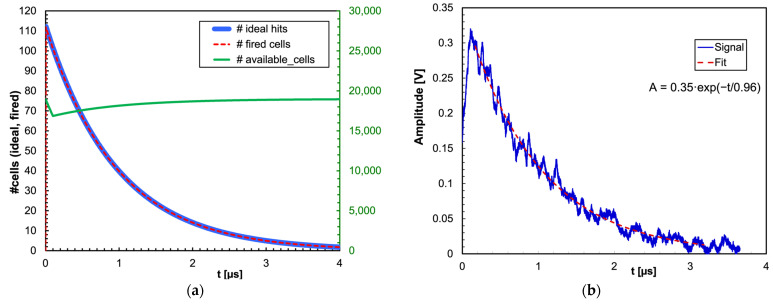
Figure 3.
(a) The number of expected ideal photon hits (dPh/dt·∆t) as a function of time for a 2 MeV gamma energy deposition is basically indistinguishable from the calculated number of real cell hits. The number of available cells as a function of time is also plotted (in green, right-hand axis). (b) A real signal, after a linear amplification, along with an exponential fit that (not surprisingly) produced the expected 960 ns decay constant. The signal fluctuations are to be ascribed to photon statistics due to the small number of expected hits.

