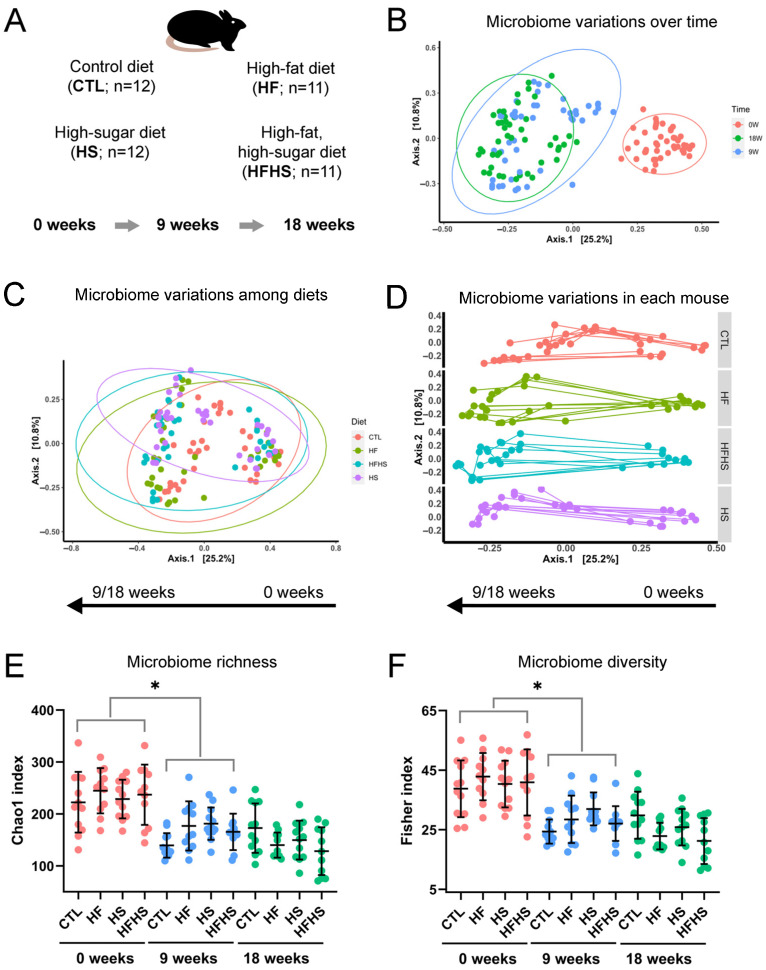
Figure 1.
Global analysis of gut microbiome alterations. (A) Experimental outline. (B–D) Principal coordinates analysis (PCoA) of microbiome alterations as a function of (B) time, (C) diet, and (D) individual experimental mouse. In panels (B,C), ellipses represent 95% confidence intervals. (E,F) Time and diet effects on the microbiome (E) richness and (F) diversity. Error bars represent mean and standard deviation. Asterisks indicate statistically significant differences between pairs of conditions from 0 and 9 weeks (please see Supplementary Tables S2 and S3 for detailed statistics).

