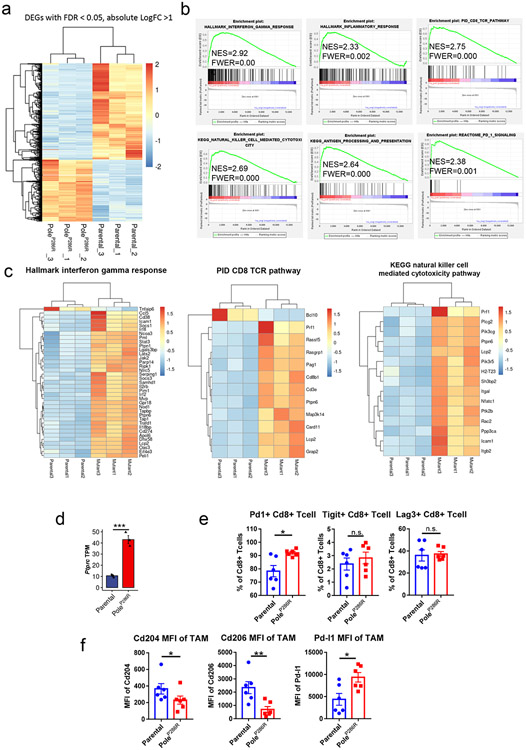
Extended data figure 2. The baseline immune microenvironment of the Pole mutant tumors.
a, Heatmap of 1298 DEGs (differentially regulated genes) from RNA-seq analysis of the B16F10 parental and PoleP286R mutant tumors 14 days post implantation. Color sale indicates normalized z-score. b, GSEA (gene set enrichment assay) indicating enrichment of gene sets related to interferon gamma response, T cell and NK cell activation, inflammation, antigen presenting pathway and PD1 signaling in the mutant tumors versus parental tumors. c, Heatmap showing DEGs (FDR P <= 0.05) between parental and mutant tumors from the Hallmark interferon gamma response pathway, PID CD8 TCR pathway and KEGG natural killer cell mediated cytotoxicity pathway. d, Ptprc TPM of parental and mutant tumors from the RNA-seq data showed in Fig. 2c (N=3 biological replicates). P=0.0008 indicate two-sided Student’s t-tests (n.s., no statistical significance, * P<0.05, ** P<0.01, *** P<0.005). Data are presented as mean values +/− SEM. e, Flow cytometry analysis of the percentage of Cd8 T cells expressing Pd-1 (P=0.026), Tigit (P=0.48) and Lag3 (P=0.78) in the parental and mutant tumors 14 days post implantation (N=6 biological replicates). P values indicate two-sided Student’s t-tests (n.s., no statistical significance, * P<0.05, ** P<0.01, *** P<0.005). Data are presented as mean values +/− SEM. f, Flow cytometry analysis of expression intensity of Pd-l1 (P=0.045), Cd204 (P=0.043) and Cd206 (P=0.0087) on tumor associated macrophages in the parental and mutant tumors 14 days post implantation (N=6 biological replicates). P values indicate two-sided Student’s t-tests at the end time points (n.s., no statistical significance, * P<0.05, ** P<0.01, *** P<0.005). Data are presented as mean values +/− s.e.m..

