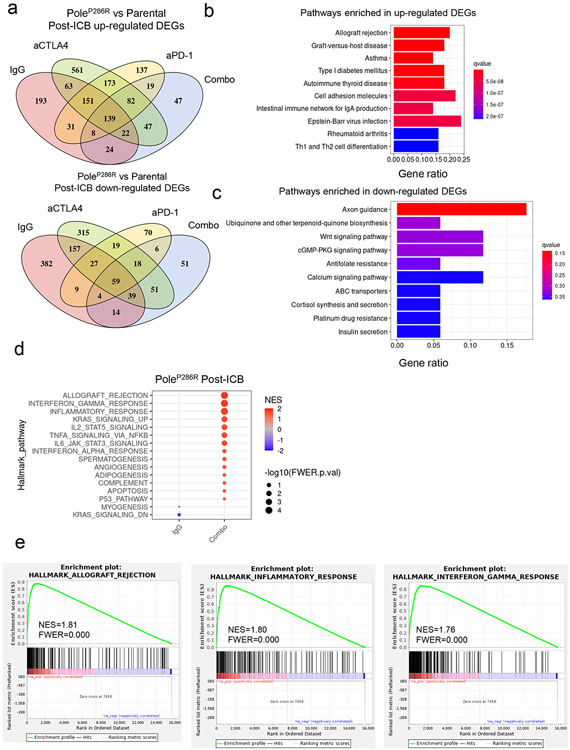
Extended data figure 3. Immune microenvironment of the post-treatment Pole mutant tumors.
a, Differentially expressed genes up-regulated or down-regulated in the post-ICB PoleP286R tumors versus the parental tumors. There are 82 DEGs that are consistently upregulated in all ICB treatment arms, while there are 59 genes are consistently downregulated in mutant tumors of all immune checkpoint blockade (ICB) arms. b, Top 10 KEGG pathways that were significantly enriched in the consistently up-regulated DEGs. c, Top 10 KEGG pathways that were enriched in the consistently down-regulated DEGs across all ICB arms. No pathway is statistical significantly enriched, as determined by q value <0.05. d, GSEA analysis of PoleP286R tumor in the combo arm versus the IgG arm. Only pathways with nominal p value <0.05 were shown. e, GSEA plot of enriched gene sets related with inflammatory response in combo ICB arm versus IgG arm of the PoleP286R tumors.

