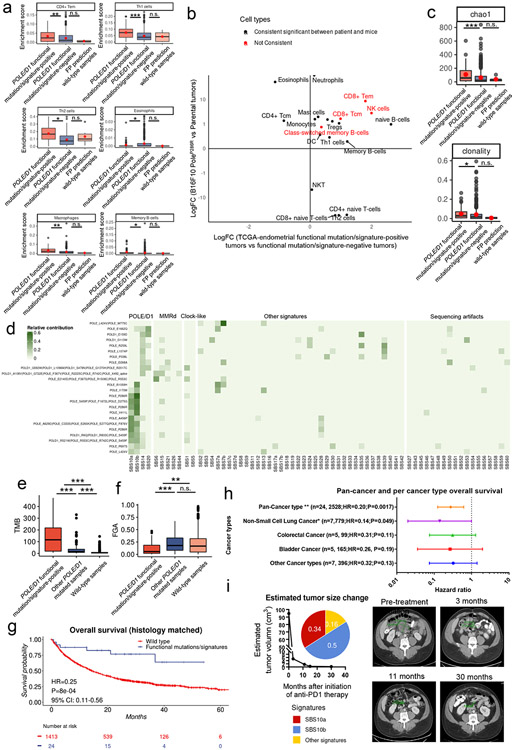
Extended data figure 8. Immune features and the outcome of patients with POLE/D1 functional mutations/signatures.
a, Enrichment scores of the immune cell types that are significantly upregulated or down-regulated in the POLE/D1 (POLE or POLD1) functional mutation/signature-positive tumors and FP (false positive) prediction wild-type tumors compared to the POLE/D1 functional mutation/signature-negative tumors (POLE/D1 functional mutation/signature-positive tumors N=60, POLE/D1 functional mutation/signature-negative tumors N=520, FP prediction wild-type tumors N=6; also see Fig. 5d). POLE/D1 functional mutation/signature-positive, tumors either harbored known POLE/D1 functional mutations, or only harbored POLE/D1 variants of unknown significance (VUS) and were positive for POLE/D1 functional signatures; POLE/D1 functional mutation/signature-positive tumors, samples were predicted as wild-type samples by the functional signature-based model, regardless of the POLE/D1 mutation status; FP prediction wild-type tumors, wild type sample predicted as POLE/D1 functional signature-positive (i.e., false positive) by the logistic regression model. P values (CD4 Tem P=0.0042; Th1 P=6.2e-5; Th2 P=1.6e-9; Eosinophils P=0.027; Macrophages P=4.8e-5; Memory B-cell P=0.036). b, Log-fold changes of the enrichment scores of different immune cell types from the human tumors (POLE/D1 functional mutation/signature-positive tumors versus POLE/D1 functional mutation/signature-negative tumors) and mouse tumors (PoleP286R baseline tumors versus parental baseline tumors). Red color indicates cell types that are consistently upregulated or downregulated with P<0.05 for both human and mouse tumor comparisons. c, Chao1 and clonality index of the TCR-beta CDR3 repertoires from the POLE/D1 functional mutation/signature-positive tumors (N=59), POLE/D1 functional mutation/signature-negative tumors (N=463), and FP prediction wild-type tumors (N=5) of the TCGA-endometrial cohort when TCR-beta CDR3 repertoire data is available. P values (Chao1 P= 8.5e-5, clonality P=0.045). d, COSMIC SBS signature profiles of the 24 POLE/D1 functional mutation/signature-positive patients in the ICB cohort. e-f. Comparison of the TMB (e) and copy number alterations (f) between the POLE/D1 functional mutation/signature-positive patients, other POLE/D1 mutated patients, and wild-type patients (N=24, 148 and 2528 patients). TMB, tumor mutational burden, non-synonymous mutation count/Mb IMPACT panel exome region (P=2.2e-5; P=0.0021). FGA, fraction of genome copy number alteration (P<2.2e-16; P=0.0095). g, Kaplan-Meier overall survival plot of the POLE/D1 functional mutation/signature-positive patients by the MSK-IMPACT logistic regression model versus the histology matched POLE/D1 wild-type patients. Log-Rank P value and hazard ratio shown were calculated from coxph model with cancer type correction. h, Forest plot of the POLE/D1 functional mutations/signatures in coxph models of overall survival after immunotherapy with cancer type correction for pan-cancer or single cancer type categories that have at least three POLE/D1 functional mutation/signature-positive patients. Number of POLE/D1 functional mutation/signature-positive patients, number of wild-type patients, hazard ratio and Log-Rank P value are shown for each cancer type category in the figure. Horizontal bars represent the 95% confidence interval for the hazard ratios. Each line indicates an individual coxph model generated for the indicated cancer type category. Error bar centres indicate Hazard ratios for each individual cox model. Statistical significance was evaluated with two-sided test. (n.s., no statistical significance, * P<0.05, ** P<0.01, *** P<0.005). i, estimated tumor size change and composition of the mutational signatures for one of the CR patients who harbored POLEP286R functional mutation. Composition of the mutational signatures, and MRI image (pre-ICB and different time point post-ICB, Green mark indicated tumor location and sizes) with estimated tumor volume curve were shown. For all boxplots (a, c, e), P values were calculated from Wilcoxon Rank Sum Test (n.s., no statistical significance, * P<0.05, ** P<0.01, *** P<0.005). The minima (0% percentile), maxima (100% percentile) were plotted as the whiskers, 25% percentile and 75% percentile were plotted as the bounds of the boxes, medians were plotted as the center bar.

