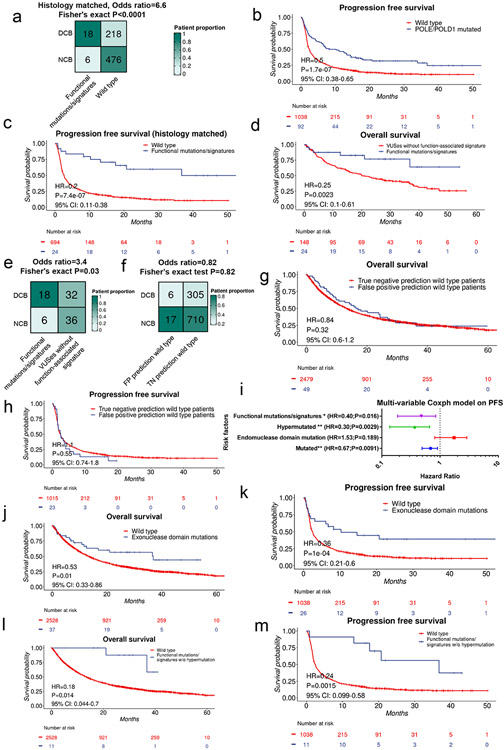
Extended data figure 9. POLE/D1 functional signatures predicts immunotherapy response.
a. Comparison of the proportion of clinical beneficial cases between the POLE/D1 (POLE or POLD1) functional mutation/signature-positive patients and the histology matched wild-type patients. Functional mutations/signatures, patients either harbored known POLE/D1 functional mutations, or only harbored POLE/D1 variants of unknown significance (VUSes) but were predicted as functional signature-positive, determined by the logistic regression model. P value was derived from Fisher’s exact test. b, Kaplan-Meier progression free survival probability plot of the patients harboring any types of POLE/D1 mutations versus POLE/D1 wild-type patients. c, Kaplan-Meier progression free survival plot of the POLE/D1 functional mutation/signature-positive patients versus the histology matched POLE/D1 wild-type patients. d, Kaplan-Meier overall survival plot of the POLE/D1 functional mutation/signature-positive patients versus the POLE/D1 functional signature-negative VUS patients. e. Comparison of the proportion of clinical beneficial cases of the POLE/D1 functional mutation/signature-positive patients to all the other POLE/D1 mutated patients after immunotherapy. P value was derived from Fisher’s exact t-test. F. Comparison of the proportion of clinical beneficial cases of the FP (false positive) prediction wild-type patients versus the TN (true negative) prediction wild-type patients upon ICB. FP prediction wild-type patients, POLE/D1 wild-type patients that were predicted as POLE/D1 functional mutation-positive by the logistic regression model. TN prediction wild-type patients, POLE/D1 wild-type patients that were predicted as wild-type samples by the logistic regression model. P value was derived from Fisher’s exact t-test. g-h, Kaplan-Meier overall survival (g) and progression free survival plot (h) of FP prediction wild-type patients versus TN prediction wild-type patients. I, A multivariable coxph model comparing the predictive capability of different patient selection strategies on the progression free survival on patients after ICB (N=1130). Hazard ratio and P value are presented in the figure. Horizontal bars represent the 95% confidence interval of the hazard ratio. Error bar centres indicate hazard ratios. Statistical significance levels were generated from the coxph model without adjustment for multiple comparison (* P<0.05, ** P<0.01, *** P<0.005). j-k, Kaplan-Meier overall survival plot (j) and progression free survival plot (k) of the POLE/D1 exonuclease domain mutation-positive patients versus the POLE/D1 wild-type patients. l-m, Kaplan-Meier overall survival plot (l) and progression free survival plot (m) of the POLE/D1 functional mutation/signature-positive patients that were not hypermutated, versus the POLE/D1 wild-type patients. For all Kaplan-Meier plots (b-d, g-h, j-m), Log-Rank P value and hazard ratio shown were calculated from coxph model with cancer type correction.

