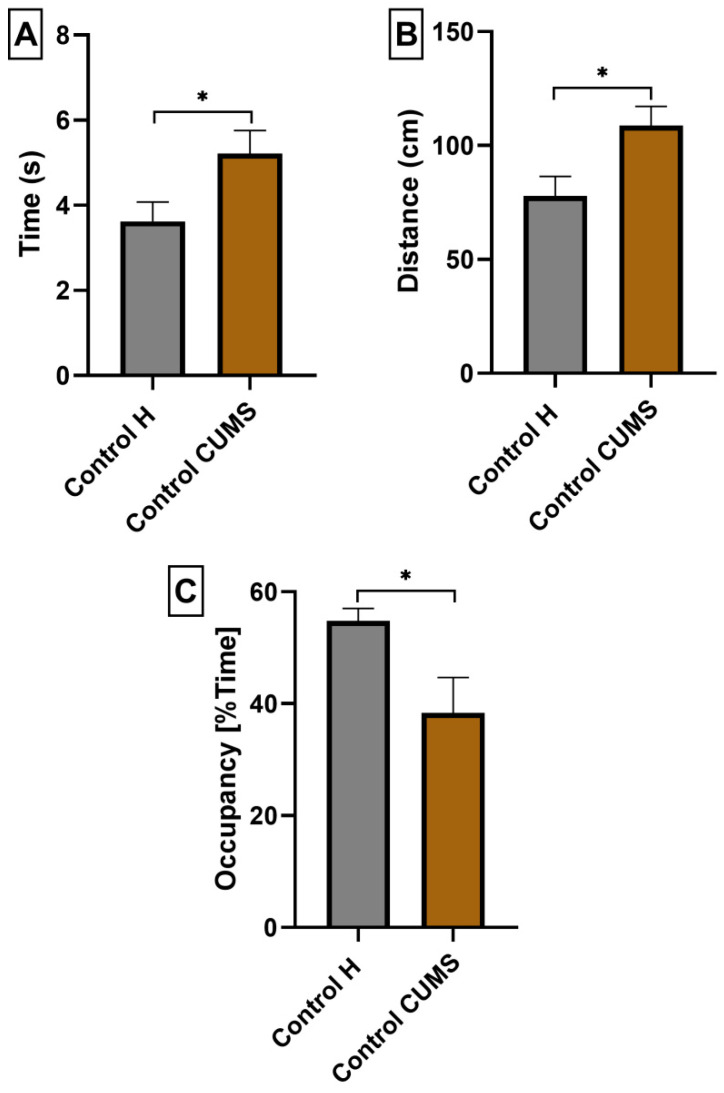
Figure 7.
The influence of CUMS induction on escape latency (A), total distance (B) and mean percentage of time spent in the W channel (C) of mice in the MWM test. The results were analyzed using t-student’s test. Each bar represents the mean for seven mice; error bars are S.E.M. (* p < 0.05; n = 7).

