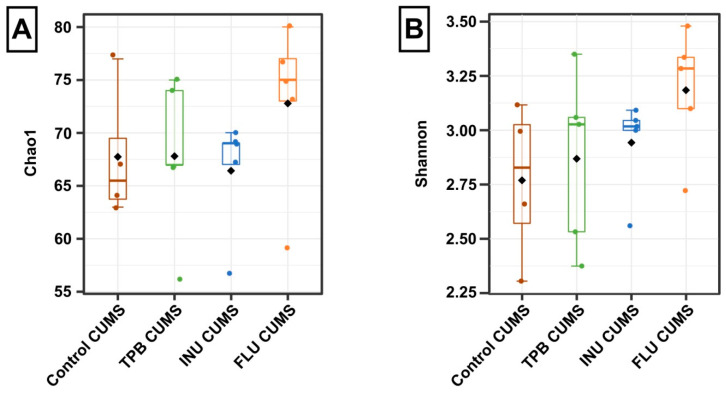
Figure 10.
Alpha diversity indices calculated for groups: Control CUMS, TPB CUMS, INU CUMS and FLU CUMS. (A)—Chao1 index; (B)—Shannon index. Boxes represent the interquartile range (IQR) and the median. Whiskers represent 1.5× the IQR. Diamonds represent the mean. The results were analyzed using the Kruskal-Wallis test. Each bar represents the mean for 5 mice. Data are presented as the mean ± S.E.M.

