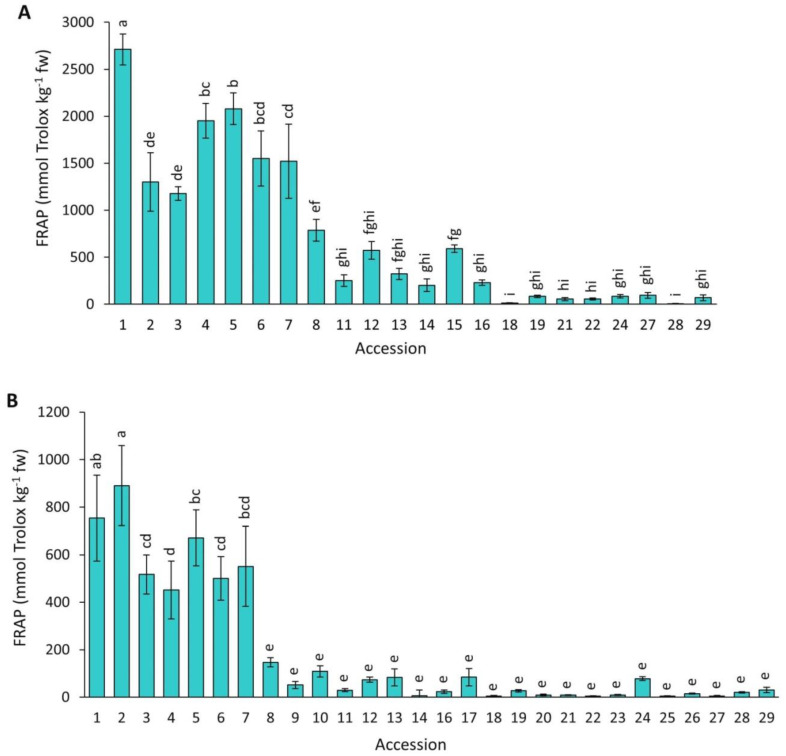
Figure 10.
Antioxidant capacity by FRAP in carrot accessions grown in 2018 (A) and 2019 (B). Accession numbers refer to the carrot materials described in Table 1. Bars indicate mean values of three replicates, expressed as mmol Trolox kg−1 fw ± SE. Mean values with a common letter are not significantly different at p ≤ 0.05 (LSD Fisher test).

