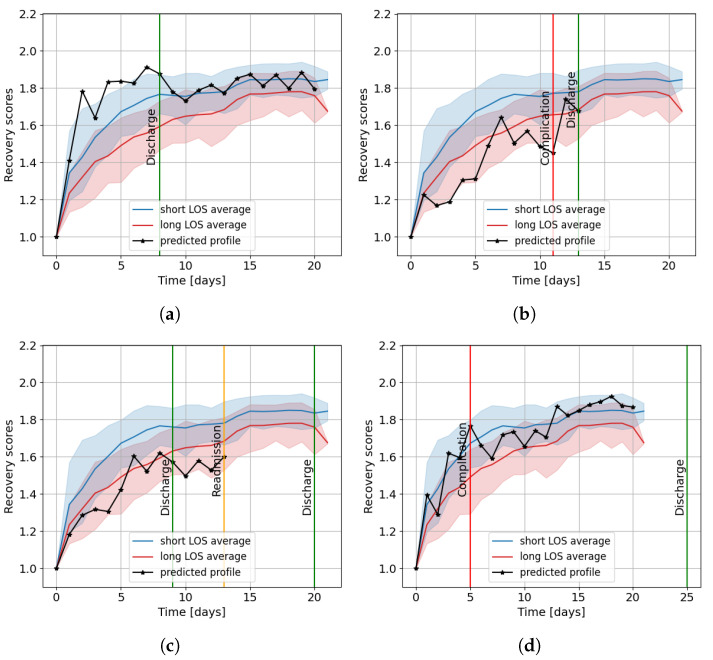
Figure 5.
The average profiles of the long LOS and short LOS groups of the entire dataset compared to the predicted individual profiles of a patient (a) with high recovery scores, (b) with low recovery scores and a complication, (c) with low recovery scores and a readmission, and (d) with average recovery scores and a complication. The error bands of the average profiles are shown as the 10th and 90th percentile, and the recorded events are visualized with vertical lines.

