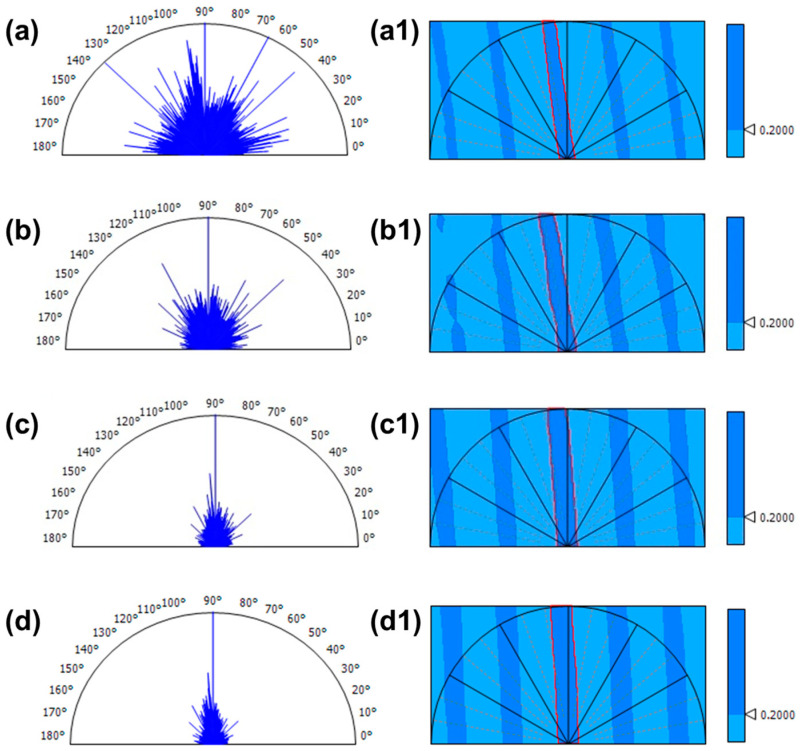
Figure 3.
Texture direction representation (based on the Fourier Transform) and texture isotropy representation (based on the autocorrelation function) supported by the AFM topography images, obtained for the phase mask laser, irradiated Az0.25PSS-L (a,a1), Az0.50PSS-L (b,b1), Az0.75PSS-L (c,c1), and Az1.00PSS-L (d,d1). The angles are measured anticlockwise. Same as in texture direction representation, in the texture isotropy representation, the black lines indicates the positions of the main angle lines (0°, 30°, 60°, 90°, 120°, 150°, 180°), the dotted orange lines indicates the positions of the intermediary angle lines and the red lines delimits the periodic motif.

