
Figure 1.
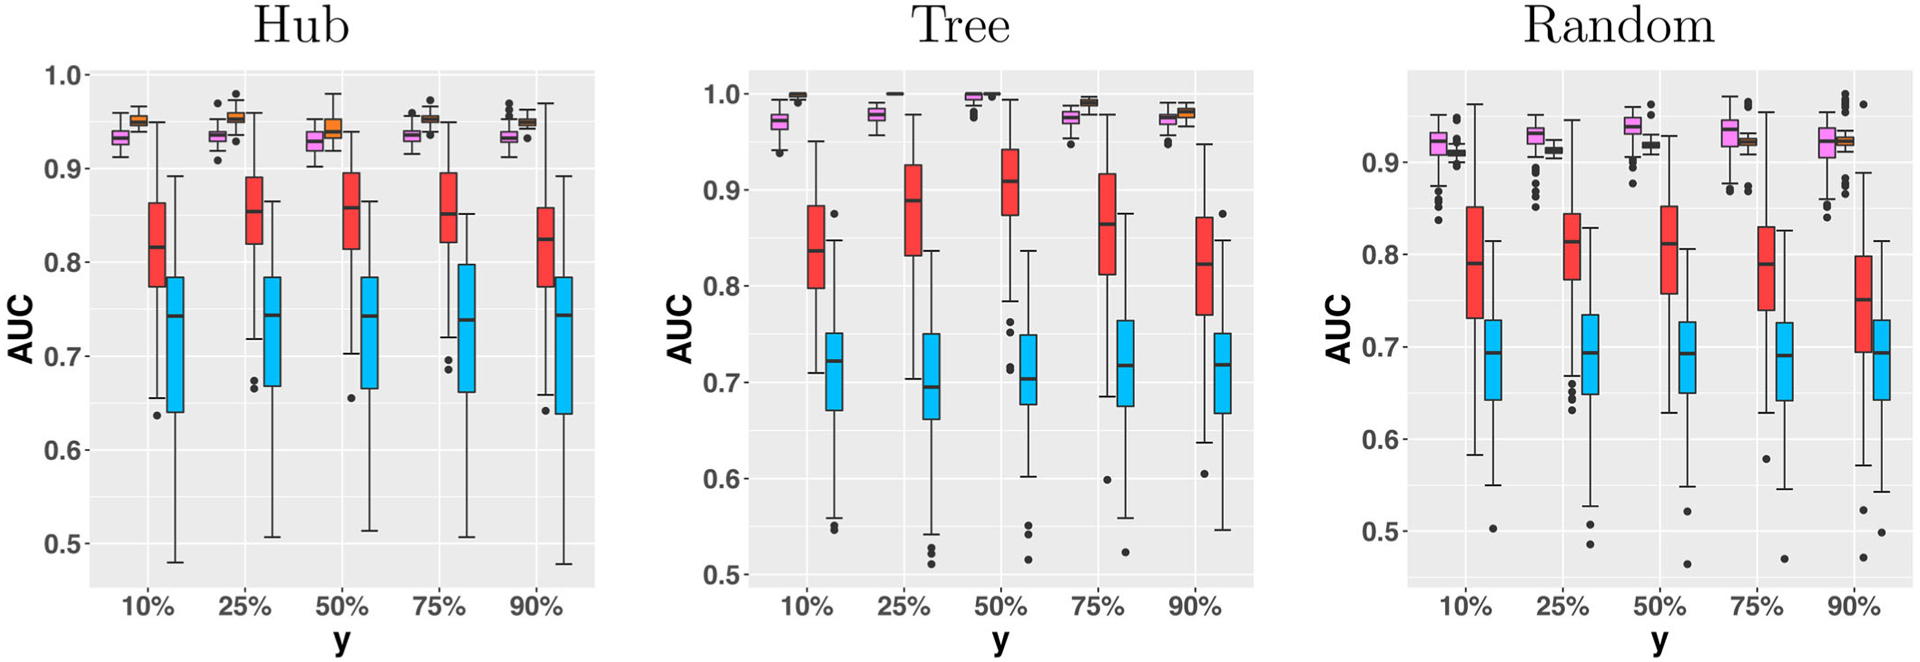
Area under the ROC curve for the estimated graph with respect to the external variable Y, under three graph structures, and by the four methods. From left to right: CPO, Average, Unconditional, Majority. The graph size p = 10.
Official websites use .gov
A
.gov website belongs to an official
government organization in the United States.
Secure .gov websites use HTTPS
A lock (
) or https:// means you've safely
connected to the .gov website. Share sensitive
information only on official, secure websites.
Area under the ROC curve for the estimated graph with respect to the external variable Y, under three graph structures, and by the four methods. From left to right: CPO, Average, Unconditional, Majority. The graph size p = 10.