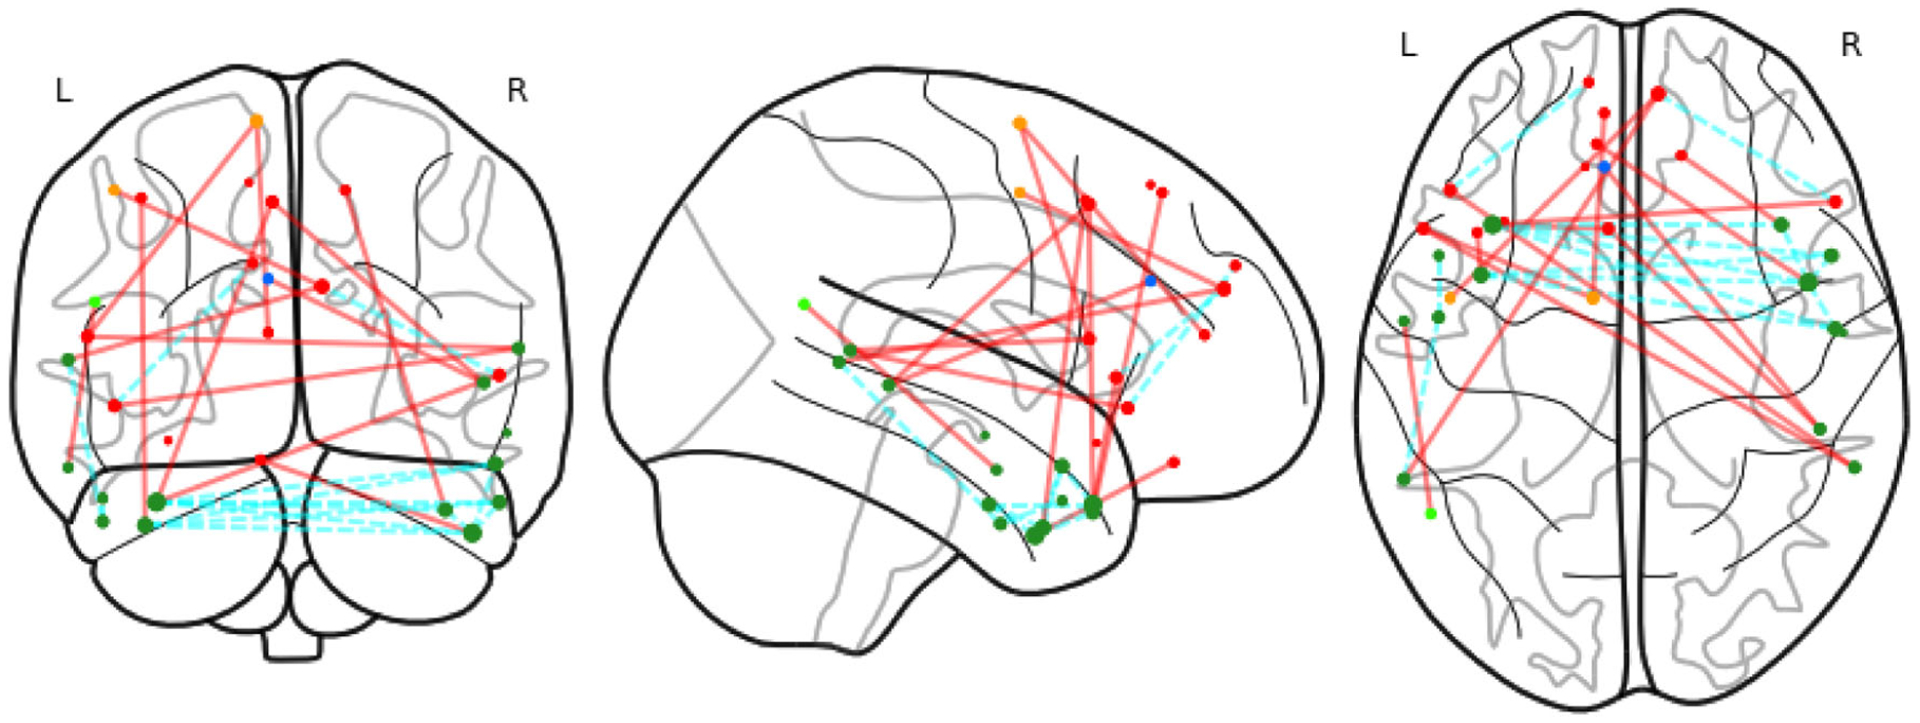
Figure 3.

Medial frontal network, with significant edges. Different colors of nodes indicate the ROIs in different lobes: prefrontal, motor, parietal, temporal, limbic and cerebellum. Red lines indicate inter-lobe edges and cyan ones for inner-lobe edges.
