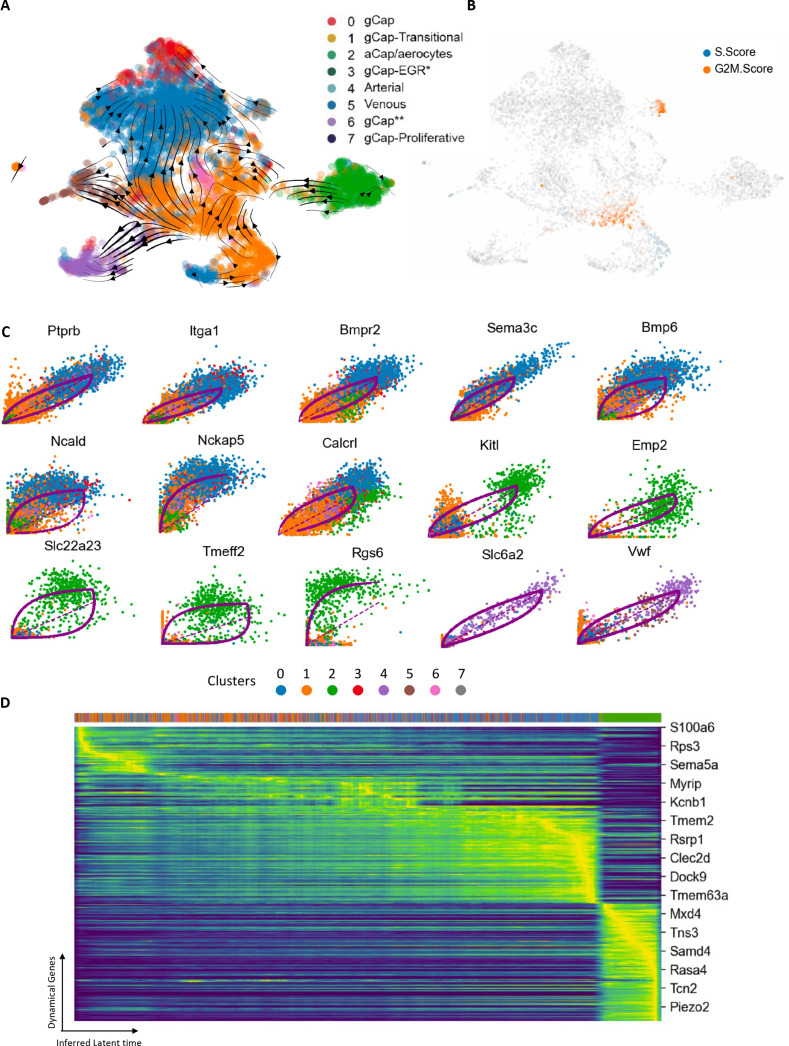
Figure 5. RNA velocity and trajectory analysis.
(A) This model showed a dynamic shift of endothelial cells (ECs) through Zones 2 and 3 of transitional Cluster 1 with strong vectors towards general capillary (gCap), arterial, and venous EC populations. (B) Zone 2 ECs of Cluster 1 exhibited evidence of DNA synthesis (blue), whereas cells in Zone 3, and proliferative cluster 7, showed increased G2M scores, consistent with their role in repopulating the lung microvasculature ECs. (C) Top 15 genes involved in specific transitions between clusters: eight genes implicated in the transition from Cluster 1 to Cluster 0; five genes for Cluster 1 to aCap ECs (Cluster 2), and two genes for Cluster 1 to venous ECs (Cluster 4). (D) Cascade of 300 top genes in the dynamical gene expression analysis. Horizontal ribbon on top identifies clusters by color coding according to the legend in panel A. Genes listed on the right was randomly selected. There was a clear progression of gene expression beginning with Cluster 1 (orange) and progressing through to Cluster 0 (blue) and finally Cluster 2 (green) at the end of the pseudotime cascade.

