. 2023 Apr 20;12:e80900. doi: 10.7554/eLife.80900

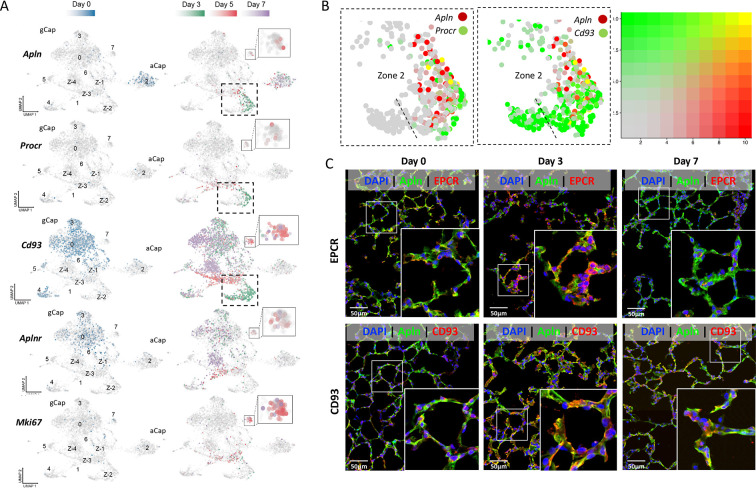
Figure 6. Apelin expression in a transitional general capillary (gCap) stem-like endothelial cell (EC) population at 3 days post-injury.

(A) Under basal conditions (day 0; blue color) Apln was only expressed by aCap ECs (aerocytes; Cluster 2), whereas Aplnr expression was seen in gCap ECs (Cd93 positive). 3 days after EC ablation (Green color), de novo apelin expression was apparent in gCap ECs of Zone 2, Cluster 1, together with Procr. At 5 days post-EC injury (Red color), Aplnr expression was seen in the adjacent Zone 3 of Cluster 1 and in Cluster 7. (B) Two-gene analysis of Zone 2 of Cluster 1 showing co-expression of Apln with Procr (left panel) and Cd93 (middle) at 3 days post-injury. Right panel shows 2-color scale with yellow indicating a complete overlap in expression and faded red/green partial overlap. (C) Immunofluorescence staining showing colocalization (yellow) of APLN, EPCR, and CD93 in Zone 2 of Cluster 1 only at 3 days post EC ablation. Scale bar is 50μm. More details in Figure 6—figure supplements 13.

Figure 6.

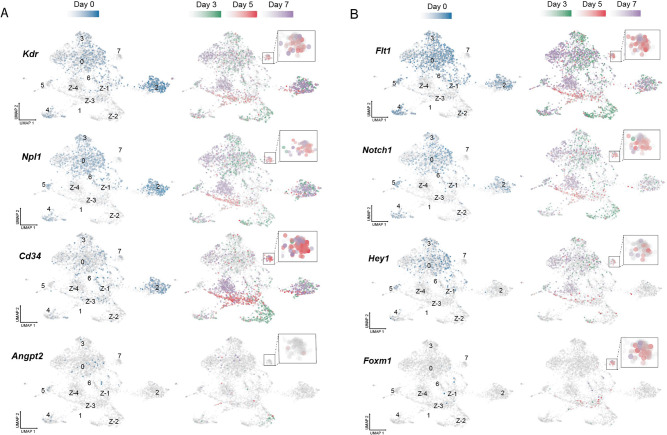
Figure 6—figure supplement 1. Temporal evolution of expression of tip and stalk cell genes pre and post-endothelial cell (EC) ablation.

Figure 6—figure supplement 1.

(A) Pdgfb (Platelet Derived Growth Factor Subunit B), (B) Npl1 (Neuropilin 1), (C) Angpt2 (Angiopoietin 2), (D) Notch1 (Notch Receptor 1), and (E) Kit (KIT Proto-Oncogene, Receptor Tyrosine Kinase). Lung ECs from control mice (blue) are shown on the left and cells from the diphtheria toxin (DT)-treated cohorts are presented on the right: Day 3 (green); day 5 (red), and day 7 (purple) with Cluster 7 enlarged in the insets.
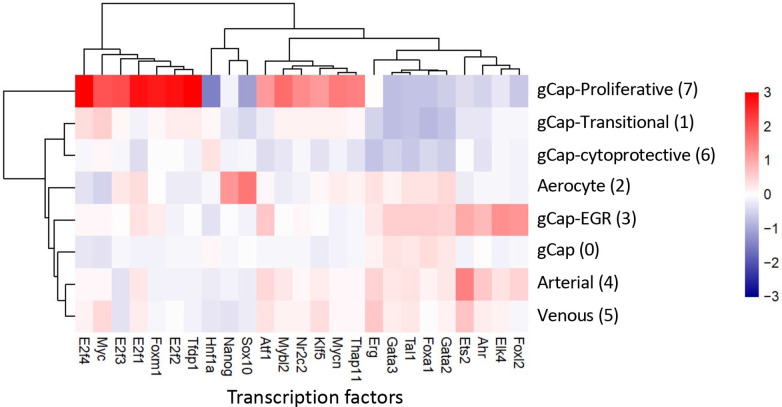
Figure 6—figure supplement 2. Unbiased inference of transcription factor (TF) activity based on known TF-gene set interactions (decoupleR) showing the top 25 significantly up- or down-regulated TFs.

Figure 6—figure supplement 2.

Different endothelial cells (ECs) populations showed very distinct profiles with the gCap proliferative ECs (Cluster 7) exhibiting 13 activated TFs, including Tfdp1 (Transcription Factor Dp-1), E2f2 (E2F Transcription Factor 2), and Foxm1, among many others, and profound downregulation of Hnf1a (Hepatocyte Nuclear Factor 1-Alpha) and Sox10 (SRY-Box Transcription Factor 10). In contrast, aCap ECs (aerocytes) showed activation of only two TFs (Sox10 and Nanog). Cluster 3 gCap-EGR ECs and arterial Cluster 4 ECs showed a very similar pattern with activation of Foxl2 (Forkhead Box L2), Elk4 (ETS Transcription Factor ELK4), Ahr (Aryl Hydrocarbon Receptor), and Ets2 (ETS Proto-Oncogene 2) among others.
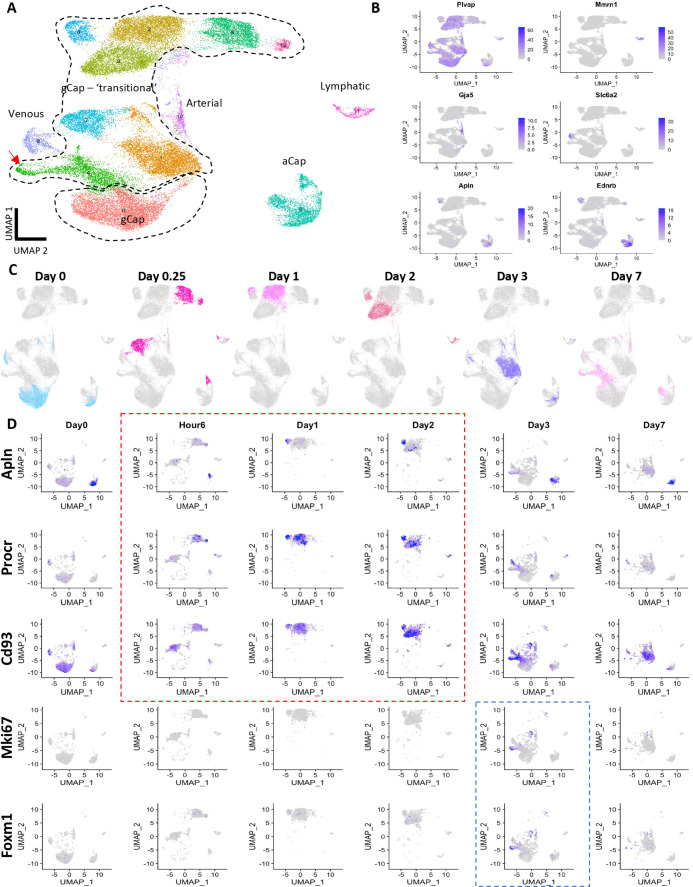
Figure 6—figure supplement 3. Serial single-cell transcriptomic analysis of a publicly available dataset endothelial cell (EC) gene expression in an endotoxin (LPS) model of acute lung injury (DOI: 10.1172/jci.insight.158079).

Figure 6—figure supplement 3.

(A) Uniform manifold approximation and projection (UMAP) dimensionality reduction reveals 13 endothelial clusters. (B) The identity of these clusters is based on markers of general capillary (gCap), aerocytes (aCap), lymphatic, arterial, and venous endothelial cells (ECs). (C) Distribution of EC cultures over time showing that the eight distinct gCap EC clusters were each specific to a single timepoint, analogous to the zones within the transitional Cluster 1 in Figure 4. (D) Temporal pattern of expression of apelin (Apln), protein C receptor (Procr), and the gGap EC marker, Cd93. Red box highlights the period of co-expression Apln and Procr in gCap ECs. Blue box highlights the appearance of Foxm1 and Mki67 expressing proliferative ECs.