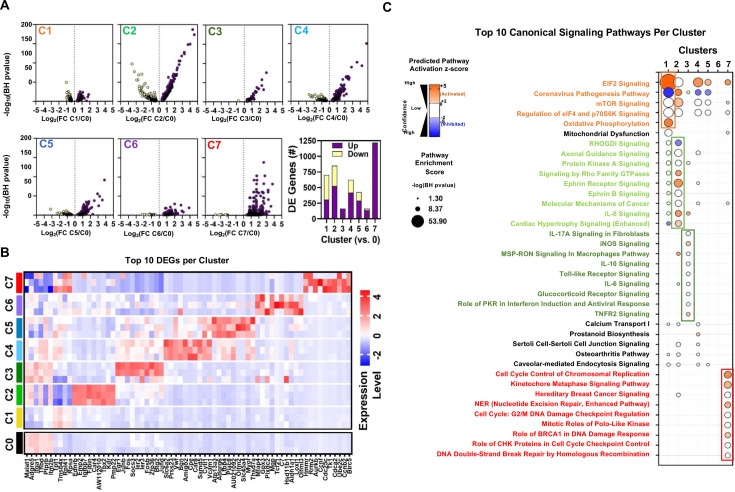
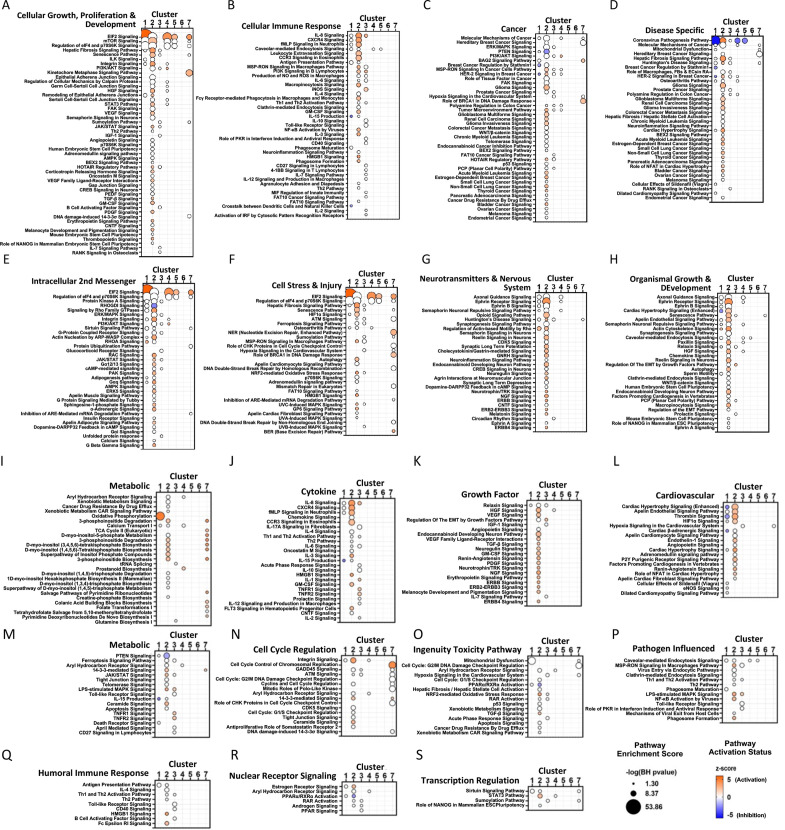
Figure 7. Differential gene expression and pathway enrichment analysis of endothelial sub-Clusters 1–7.
(A) Volcano plots showing the distribution of differentially expressed genes in Clusters 1–7 (C1 to C7) according to statistical significance (Benjamini-Hochberg (BH) adjusted p-value), magnitude and direction of fold change (FC) relative to Cluster 0 (at baseline time 0). Only genes that passed the false discovery rate threshold (FDR) <0.05 are shown. Bar chart summarizes the number of differentially expressed (DE) genes in each cluster (versus Cluster 0). Purple and yellow bars are stacked to show the proportion of genes that were upregulated and downregulated, respectively. (B) Heatmap shows expression levels of 68 genes representing the combined top 10 differentially expressed genes in Clusters 1–7 (versus Cluster 0) at baseline day 0. Mean expression levels (z-score of log-transformed normalized counts) are shown for n=3 mice/cluster. (C) Pathway enrichment analysis using DE gene sets from panel A with Ingenuity Pathway Analysis. Identity of 38 canonical signaling pathways representing the combined top 10 most significantly enriched pathways in each endothelial subcluster and the associated overlap between clusters. Of note, some pathways may be classified in more than one cluster. Circle size denotes the pathway enrichment score based on the BH-adjusted p-value. A minimum score of 1.3 (i.e. FDR <0.05) was used as an inclusion threshold. Z-score color denotes the predicted activation state of the pathway based on the degree of matching between the expected and observed pattern of gene expression changes. Only pathways with z-score >+2 (activated) or <−2 (inhibited) are shown in color to highlight confident predictions. White circles denote pathways in which the activation state cannot be confidently predicted. No pathways were significantly enriched in DE genes from Cluster 6 at FDR <0.05. The identities of all significantly enriched canonical pathways are presented in Figure 7—figure supplement 1.


