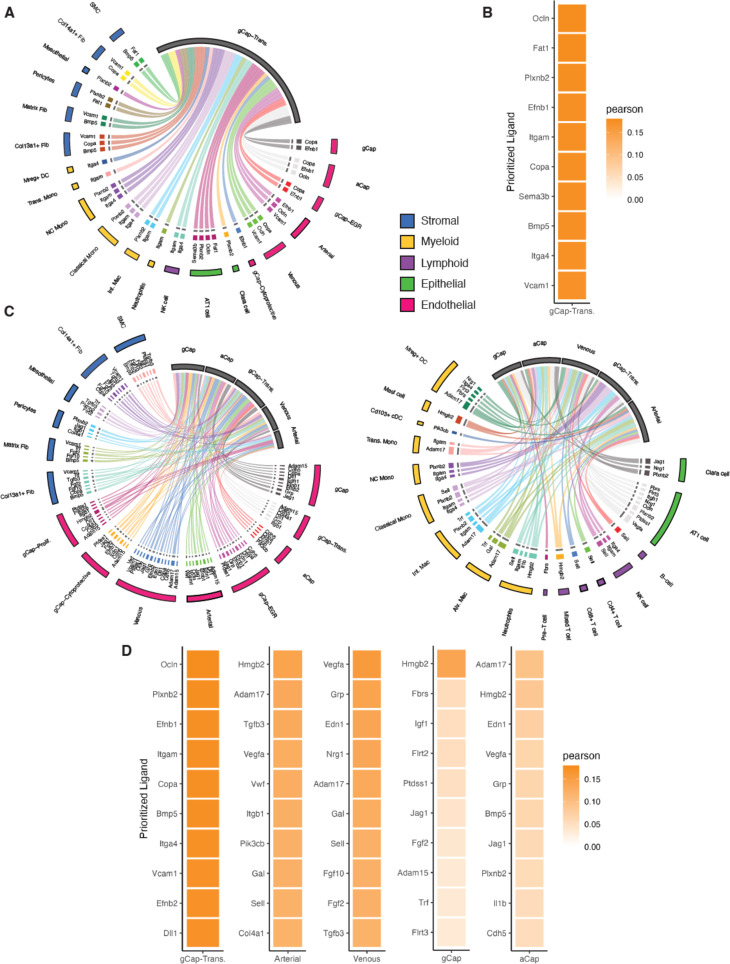
Figure 9. Cell Signaling inferences using NicheNet.
Circos plots showing color-coded sender populations (outer circle) indicating the 10 top genes signaling for each receiver population (shown in gray). (A) At day 3, only one population, general capillary (gCap)-transitional Cluster 1, met the criteria for a ‘receiver’ and this cluster received signals form 21 separate cell clusters representing five distinct cell populations (stromal, myeloid, lymphoid, epithelial, and endothelial). (B) Heatmap shows the Pearson’s correlation coefficients of the top 10 ligand-receptor interactions for the gCap endothelial cell (EC) receiver population. (C) At day 5, there was a substantially greater diversity in cell-cell interactions, with five endothelial receiver populations responding to signals from 31 cell clusters. (D) Heatmaps of Pearson’s correlation coefficients of the top 10 ligand-receptor interactions for each receiver population.

